Velocity–time graphs: gradient and area
What the axes mean
- A velocity–time graph has time on the horizontal axis and velocity on the vertical axis.
- The height of the line at any moment is the velocity at that moment.
- A line below the axis means the object is moving in the negative direction.
The gradient is the acceleration
- A horizontal line means constant velocity, so zero acceleration.
- A line sloping up means the object is speeding up in the positive direction.
- A line sloping down means a negative acceleration.
- A steeper line means a larger acceleration.
- A curved line means the acceleration itself is changing — the equations of motion cannot be used across that section.
The area under the line is the displacement
- Break the shape into rectangles and triangles, find each area, and add them:
- rectangle:
- triangle:
- trapezium: split it into a rectangle plus a triangle.
- Area below the axis counts as negative displacement.
- For total distance, add the sizes of all the areas.
- For displacement, subtract the areas below the axis from those above.
Set the initial velocity and acceleration below, then watch the ball move as the time cursor sweeps both graphs together. Notice how a steeper velocity–time line (bigger acceleration) makes the position–time curve bend more sharply.
The v–t gradient is a; the area under v–t is the distance x.
Drag a graph to scrub time.
Telling the two graphs apart
This is the single most-confused pair of ideas in the topic:
| distance–time | velocity–time | |
|---|---|---|
| Gradient gives | velocity | acceleration |
| Area gives | nothing useful | displacement |
| Horizontal line means | stationary | constant velocity |
| Line at zero means | at the starting point | stationary |
| Straight sloping line means | constant velocity | constant acceleration |
- Check the vertical axis label before you do anything else. The same shaped line means completely different motions on the two graphs.
Describing a journey from a v–t graph
A full description names each stage and gives numbers:
- State what is happening (accelerating uniformly / constant velocity / decelerating).
- Give the acceleration from the gradient, with a unit.
- Give the distance for that stage from the area.
- Say when the object is stationary — that is where the line touches the time axis, not where it is horizontal.
Worked ExampleGradient and area on a two-stage graph
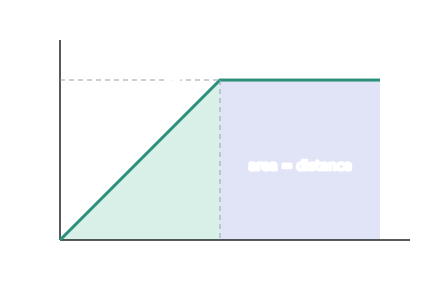
A runner accelerates uniformly from rest to m s−1 in s, then holds m s−1 for another s. Find the acceleration in the first stage and the total distance travelled.
Step 1 — Acceleration is the gradient of the first stage
In the second stage the line is horizontal, so .
Step 2 — Distance is the area under the whole line
Split the shape into a triangle (the accelerating stage) and a rectangle (the steady stage):
Worked ExampleA journey that reverses direction
An object's velocity–time graph is a straight line from down to , continuing down to . Find (a) the acceleration, (b) the total distance travelled and (c) the displacement.
Step 1 — Acceleration is the gradient of the whole line
The line is straight throughout, so one gradient covers it all:
Step 2 — Identify the two areas
The line crosses the time axis at s. That is where the object stops and reverses, so there are two triangles:
- above the axis, to s: m
- below the axis, to s: m, but below the axis, so m
Step 3 — Distance adds the sizes
Step 4 — Displacement keeps the signs