Changes in the world price
Why the world price moves
- The world price is set by world supply and world demand, neither of which New Zealand can influence.
- Common causes examined:
- World demand rises — for example rising incomes in a large importing country lift demand for New Zealand dairy or meat.
- World supply falls — drought, disease or conflict in a major producing country.
- World supply rises — a new producing region comes online.
- A trade agreement removes a tariff in an importing country, raising the effective price New Zealand exporters receive.
What happens on the model
- The domestic demand and supply curves do not move. New Zealand's own market has not changed.
- Only the horizontal Sw line shifts — up for a price rise, down for a price fall.
- The new Qd and Qs are read off the unchanged domestic curves at the new world price.
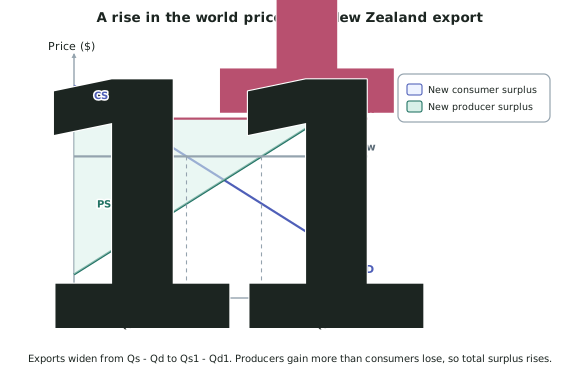
A rise in the world price of an export good
- The horizontal line moves up, from Pw to Pw1.
- Domestic quantity supplied rises — production is more profitable, a movement along the supply curve.
- Domestic quantity demanded falls — the good is less affordable at home, a movement along the demand curve.
- Exports widen, from Qs − Qd to the larger Qs1 − Qd1.
Impacts
- Consumers lose — higher price, less consumed. CS falls.
- Producers gain — higher price, more produced, and more sold overseas. PS rises.
- Total surplus rises, because the producers' gain outweighs the consumers' loss.
- New Zealand's current account improves, because export receipts rise. (Detail belongs to AS91403 — mention it, do not develop it here.)
A fall in the world price of an import good
- The horizontal line moves down.
- Domestic quantity demanded rises, domestic quantity supplied falls, and imports widen.
- Consumers gain, producers lose, total surplus rises.
The rule that covers all four cases
| World price | Export good | Import good |
|---|---|---|
| Rises | Producers gain, consumers lose, exports widen | Producers gain, consumers lose, imports narrow |
| Falls | Producers lose, consumers gain, exports narrow | Producers lose, consumers gain, imports widen |
- In every case, producers follow the price and consumers move against it. The trade gap widens whenever the price moves further from the domestic equilibrium and narrows whenever it moves towards it.
Worked ExampleA rise in the world price of a New Zealand export
An illustrative New Zealand market for logs trades at a world price of Pw = $6.00 per unit. At that price:
- Domestic quantity demanded is 30,000 units
- Domestic quantity supplied is 75,000 units
Strong construction demand overseas lifts the world price to Pw1 = $8.00. At $8.00:
- Domestic quantity demanded falls to 18,000 units
- Domestic quantity supplied rises to 95,000 units
Explain the impact on exports, on New Zealand consumers and on New Zealand producers.
Step 1 — Show the change on the model
The domestic demand and supply curves do not move — nothing has changed inside New Zealand.
The world supply line Sw shifts up from $6.00 to $8.00, and it stays horizontal because New Zealand is still a price taker.
Step 2 — Calculate exports before
Exports = Qs − Qd = 75,000 − 30,000 = 45,000 units
Step 3 — Calculate exports after
Exports = Qs1 − Qd1 = 95,000 − 18,000 = 77,000 units
Exports widen by 32,000 units. They grow from both ends: producers supply 20,000 more and domestic consumers take 12,000 fewer.
Step 4 — Impact on New Zealand consumers
The domestic price rises from $6.00 to $8.00, because New Zealand producers will not sell at home for less than they can get overseas.
New Zealand consumers therefore pay $2.00 more on the units they still buy, and they cut back from 30,000 to 18,000 units because logs are now less affordable. This is a movement along the demand curve.
Consumer surplus falls on both counts.
Step 5 — Impact on New Zealand producers
Producers receive $8.00 instead of $6.00 on every unit, and production is now more profitable, so they expand output from 75,000 to 95,000 units — a movement along the supply curve.
Producer surplus rises on both counts, and the rise is large: they gain $2.00 on the 75,000 units they were already producing, plus new surplus on the 20,000 extra units.
Step 6 — Total surplus and the wider effect
The producers' gain exceeds the consumers' loss, so total surplus in New Zealand rises.
Export receipts rise from $6.00 × 45,000 = $270,000 to $8.00 × 77,000 = $616,000, which improves New Zealand's current account.
Step 7 — The distributional point
New Zealand is better off overall, but the gain and the loss fall on different New Zealanders. Log producers and their employees gain; New Zealand builders and homeowners buying timber pay more. A question asking you to compare and contrast the impacts on participants is asking for exactly this split.