Quotas and restricting the number of sellers
What a quota is
- A quota is a legal limit on the quantity that may be produced or sold.
- Unlike a price control, it acts on quantity directly.
- New Zealand's Quota Management System for commercial fishing is a real example: the total allowable catch for each species is capped.
- Restricting the number of sellers — for example licensing only a fixed number of retailers — works the same way on the model, because fewer sellers means less can be supplied at every price.
What it does to the model
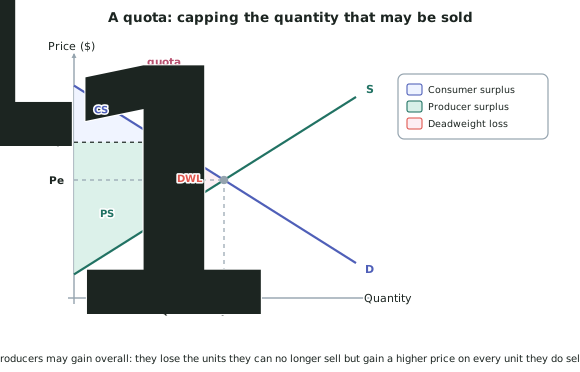
- Supply becomes vertical at the quota quantity. Beyond that quantity, no more may legally be sold at any price.
- The effective supply curve is the original supply curve up to the quota, then vertical.
- The price is set by demand at the quota quantity — read straight up from the quota to the demand curve.
The impacts
Consumers
- Pay a higher price, P1 instead of Pe, read up from the quota to the demand curve.
- Buy less, Q1 instead of Qe.
- Consumer surplus falls on both counts. This one is unambiguous.
Producers
- Receive a higher price on every unit they do sell — they gain the rectangle between Pe and P1 out to Q1.
- But they lose the units between Q1 and Qe entirely.
- Producer surplus may rise or fall. If demand is inelastic, the price gain is large and the quantity loss small, so producers usually gain. If demand is elastic, they usually lose.
- This is why producers sometimes lobby for quotas. A quota can be a way of raising the price by restricting supply.
The government
- Gains no revenue — this is the key contrast with a tariff or a tax.
- The value that a tax would have collected instead goes to producers as extra surplus, or to whoever holds the quota rights.
Allocative efficiency
- A deadweight loss triangle appears between Q1 and Qe, bounded by demand above and supply below.
- The market is allocatively inefficient.
Quota versus tax: the same quantity, a different winner
- Set a tax and a quota that produce the same traded quantity Q1, and consumers face the same price and the same loss of surplus either way.
- The difference is entirely in where the middle rectangle goes:
- Under a tax, it goes to the government as revenue.
- Under a quota, it goes to producers as extra surplus.
- The deadweight loss is identical. So the choice between them is a distributional choice, not an efficiency one.
Worked ExampleA quota on a domestic market
An illustrative market for a shellfish species is in free market equilibrium at Pe = $18 per kilogram and Qe = 900 tonnes.
The government sets a quota limiting the catch to 500 tonnes. At 500 tonnes:
- The demand curve is at a height of $26
- The supply curve is at a height of $12
Explain the impact on consumers, producers, the government and allocative efficiency.
Step 1 — Find the new price
Supply is now vertical at 500 tonnes, so the price is set by demand at that quantity.
Reading up from 500 tonnes to the demand curve gives P1 = $26.
The price has risen from $18 to $26, a rise of $8 per kilogram.
Step 2 — Impact on consumers
Consumers pay $26 instead of $18 on the 500 tonnes they still buy, and they no longer get the 400 tonnes between 500 and 900.
Consumer surplus falls for both reasons — the offset between price and quantity working against them on both sides. This effect is unambiguous.
Step 3 — Impact on producers
Producers face two opposite effects:
- Gain: on every one of the 500 tonnes they still sell, they now receive $26 instead of $18, a gain of $8 per kilogram. This is a rectangle of extra surplus between $18 and $26, out to 500 tonnes.
- Loss: they no longer sell the 400 tonnes between 500 and 900, so they lose the surplus they were earning on those.
Here the price rise is large ($8 on a base price of $18, a 44% rise) while quantity falls by 44%. Whether producers gain overall depends on the elasticity of demand. Because the price rose so steeply for a given cut in quantity, demand is relatively inelastic, which means the price gain is likely to outweigh the quantity loss and producers are probably better off.
That is exactly why quota holders often defend quotas.
Step 4 — Impact on the government
The government collects no revenue at all.
Compare this with a tax that produced the same 500-tonne outcome: the government would have collected the difference between the $26 consumers pay and the $12 the supply curve shows as the cost of the 500th tonne — that is, $14 per kilogram on 500 tonnes. Under a quota that entire value goes to producers instead.
Step 5 — Impact on allocative efficiency
400 tonnes that used to be traded no longer are. Over that range the demand curve lies above the supply curve, so each of those tonnes was worth more to consumers than it cost to catch.
The deadweight loss is the triangle between Q1 = 500 and Qe = 900:
base = 900 − 500 = 400 tonnes height = 12 = $14
DWL = ½ × 400 × $14 = $2,800 (in thousands of dollars, given tonnes and dollars per kilogram)
Because a deadweight loss exists, the market is allocatively inefficient.
Step 6 — The point the efficiency model does not capture
A fishing quota exists to prevent over-fishing, which is a sustainability problem the supply and demand model does not show. The free market quantity of 900 tonnes may be efficient this year and destroy the fishery entirely within a decade. Say so as a separate point — it does not change the efficiency verdict, but it is why the policy exists.