Consumer surplus, producer surplus and total surplus
Consumer surplus
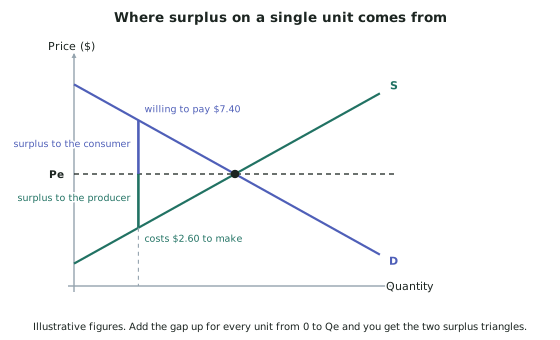
- Consumer surplus (CS) is the difference between what consumers are willing to pay and what they actually pay.
- The height of the demand curve at any quantity is the maximum a consumer would pay for that unit.
- The market price is what they do pay.
- The gap between the two, added up over every unit bought, is consumer surplus.
- On the model, consumer surplus is the area below the demand curve and above the price line, up to the quantity traded.
Producer surplus
- Producer surplus (PS) is the difference between what producers actually receive and the minimum they would accept.
- The height of the supply curve at any quantity is the cost of producing that unit — the lowest price a producer would accept for it.
- The market price is what they do receive.
- On the model, producer surplus is the area above the supply curve and below the price line, up to the quantity traded.
Total surplus
- Total surplus is simply CS + PS. The standard calls it "total surpluses".
- It measures the whole gain to society from the market existing at all.
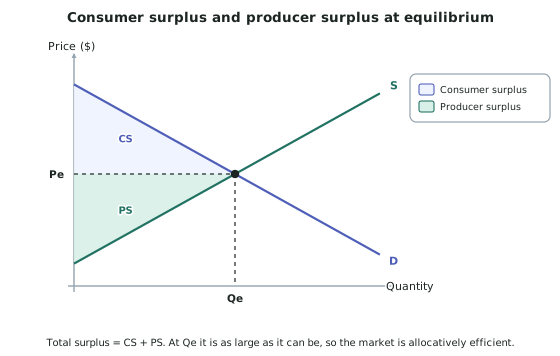
- At the free market equilibrium, total surplus is at its maximum. That is exactly what the standard means by allocative efficiency.
Why equilibrium maximises total surplus
- Take any unit to the left of Qe. The demand curve is above the supply curve there, so the unit is worth more to a consumer than it costs to make. Trading it adds to total surplus.
- Take any unit to the right of Qe. The supply curve is above the demand curve, so the unit costs more to make than anyone values it at. Trading it would subtract from total surplus.
- Qe is exactly the point where those two run out. Every worthwhile unit is made, and no worthless one is.
Calculating the areas
- Both surpluses are triangles when demand and supply are straight lines, so:
Area of a triangle = ½ × base × height
- Base — the equilibrium quantity, read off the horizontal axis.
- Height — for CS, the vertical distance from Pe up to the price where demand meets the price axis. For PS, from Pe down to where supply meets the price axis.
- With a tax, subsidy or price control the shapes become trapeziums and rectangles, so split them into a rectangle plus a triangle and add.
Worked ExampleCalculating consumer and producer surplus
In the illustrative market below, demand and supply are straight lines.
- Demand meets the price axis at $9.00
- Supply meets the price axis at $1.00
- Equilibrium price Pe = $5.00
- Equilibrium quantity Qe = 5,000 units
Calculate consumer surplus, producer surplus and total surplus.
Step 1 — Set up consumer surplus
Consumer surplus is the triangle below demand and above the price line, from 0 to Qe.
Its base is the equilibrium quantity, 5,000 units. Its height is the distance from the price line up to where demand meets the price axis:
height = 5.00 = $4.00
Step 2 — Calculate consumer surplus
CS = ½ × base × height CS = ½ × 5,000 × $4.00
CS = $10,000
Step 3 — Set up producer surplus
Producer surplus is the triangle above supply and below the price line, from 0 to Qe.
Its base is the same 5,000 units. Its height is the distance from where supply meets the price axis up to the price line:
height = 1.00 = $4.00
Step 4 — Calculate producer surplus
PS = ½ × 5,000 × $4.00
PS = $10,000
Step 5 — Add them
Total surplus = CS + PS = 10,000
Total surplus = $20,000