Venn diagrams
What a Venn diagram is for
- A Venn diagram shows how events overlap. It is the best representation when a question describes memberships that can combine freely — people who own a cat, a dog, both or neither.
- Use a Venn diagram when you are given information about unions, intersections and complements. Use a two-way table when the data are counts cross-classified by two variables, and a tree when the situation happens in stages.
The regions of a two-set diagram
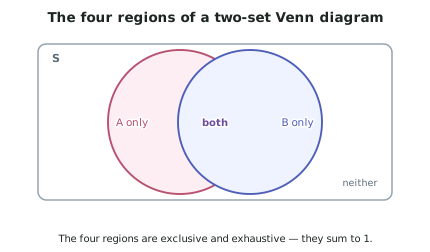
- A two-set diagram has exactly four regions, and together they account for everyone:
- only
- both and (the intersection)
- only
- neither — inside the rectangle, outside both circles.
- The four regions are mutually exclusive and exhaustive, so their probabilities sum to 1. That is your check every time.
Filling one in — always start in the middle
- The order matters, and doing it wrongly is the main source of errors:
- 1. Put the intersection in first — the "both" value.
- 2. Subtract to get the "only" regions: only .
- 3. Fill "neither" last, as minus everything else.
- The circle labelled contains everyone in , including those also in . The number written in the " only" region is not — a distinction worth checking every time you read a diagram.
Three-set diagrams
- A three-set diagram has eight regions: the triple overlap, three double-only overlaps, three singles-only, and "none".
- Always work outwards from the centre:
- Fill the triple intersection first.
- Then each pair intersection, subtracting the triple from each.
- Then each single, subtracting the two relevant pair-only regions and the triple.
- Then none.
- Getting this order wrong double-counts the centre, which is the classic three-set error.
Reading probabilities off the diagram
| In words | Regions to add |
|---|---|
| only both | |
| only both only (everything in either circle) | |
| the intersection alone | |
| outside both circles | |
| only only | |
| only | |
| intersection ( only intersection) |
- Note the last row: a conditional probability from a Venn diagram means dividing by everything inside the conditioning circle, not by 1.
Mutually exclusive events on a Venn diagram
- Mutually exclusive events are drawn as circles that do not overlap — there is no intersection region because .
- Independence cannot be seen by looking. It is a numerical relationship between the regions, not a visual feature, so it must be checked by calculation.
Worked ExampleA three-set Venn diagram
A survey of 240 Year 12 students asked which of three subjects they study: Biology (B), Chemistry (C) and Physics (P).
- 118 study Biology
- 96 study Chemistry
- 84 study Physics
- 47 study Biology and Chemistry
- 38 study Biology and Physics
- 41 study Chemistry and Physics
- 22 study all three
(a) Draw the Venn diagram and find how many study none of the three. (b) Find the probability a randomly chosen student studies exactly one of the three subjects. (c) Find the probability a student studies Physics given that they study Chemistry. (d) Are "studies Biology" and "studies Physics" independent?
(a) Filling the diagram
Step 1 — Centre first. All three: 22.
Step 2 — Pair-only regions. Each given pair figure includes the 22 in the centre, so subtract it.
Step 3 — Single-only regions. Each subject total includes everything inside its circle, so subtract the two pair-only regions and the centre.
Step 4 — None.
Check: ✓
(b) Exactly one subject
Step 1 — Identify the regions. "Exactly one" means the three single-only regions: 55, 30 and 27.
Step 2 — Convert to a probability.
(c) Physics given Chemistry
Step 1 — Identify the conditioning group. "Given they study Chemistry" restricts us to the whole Chemistry circle, which contains 96 students.
Step 2 — Find how many of those also study Physics. Inside the Chemistry circle, the Physics students are the and only region plus the centre:
(This is the given "Chemistry and Physics = 41", which is a useful check.)
Step 3 — Divide.
Compare with : taking Chemistry makes a student more likely to take Physics than a randomly chosen student is.
(d) Independence of Biology and Physics
Step 1 — Assemble the probabilities.
Note that uses the given 38, which includes the 22 taking all three — everyone in both circles counts.
Step 2 — Apply the test.
Step 3 — Compare.
Step 4 — Interpret in context.