The AS/AD model: what it is and how to shift it
The model you will be given
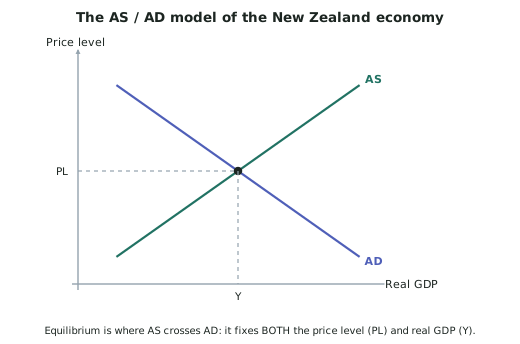
- The Aggregate Supply / Aggregate Demand (AS/AD) model shows the whole economy on one diagram.
- Vertical axis: the price level (PL) — the general level of prices, not the price of one good.
- Horizontal axis: real GDP (Y) — the total quantity of goods and services actually produced.
- Aggregate demand (AD) — the total spending on New Zealand-produced goods and services at each price level. It slopes downward.
- Aggregate supply (AS) — the total output firms are willing to produce at each price level. It slopes upward.
- Where the two cross is equilibrium, and it fixes both the price level and real GDP.
You are not required to know why the curves slope the way they do. The standard says explicitly that "an understanding of how to derive the AS and AD curves is not required". You need to know what moves them and what happens when they move.
What is in aggregate demand
- AD is total spending, and it has four components:
-
— consumption: household spending
-
— investment: firms buying capital goods
-
— government spending
-
— net exports: export receipts minus import payments
-
Anything that changes one of those four shifts AD.
What shifts AD, and which way
| Event | Component | AD shifts |
|---|---|---|
| Interest rates fall | and rise | Right |
| A cost-of-living payment to households | rises | Right |
| Large-scale job losses | falls | Left |
| Government cuts spending | falls | Left |
| Export receipts rise | rises | Right |
| Consumer confidence falls | falls | Left |
| A major event brings visitors and spending to a region | rises | Right |
What shifts AS, and which way
- AS shifts when the cost of production or the productive capacity of the economy changes.
| Event | Effect on costs / capacity | AS shifts |
|---|---|---|
| Wage costs rise | Costs up | Left |
| Petrol and freight prices fall | Costs down | Right |
| A cyclone damages farms and roads | Costs up, capacity down | Left |
| Imported raw materials get cheaper | Costs down | Right |
| New technology raises productivity | Capacity up | Right |
| A new tax on business inputs | Costs up | Left |
The four possible outcomes
| Shift | Price level | Real GDP |
|---|---|---|
| AD right | Rises | Rises |
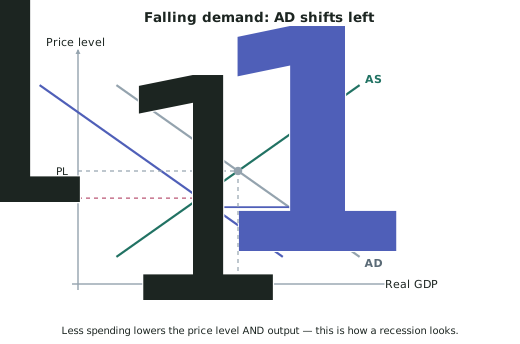
| AD left | Falls | Falls |
| AS left | Rises | Falls |
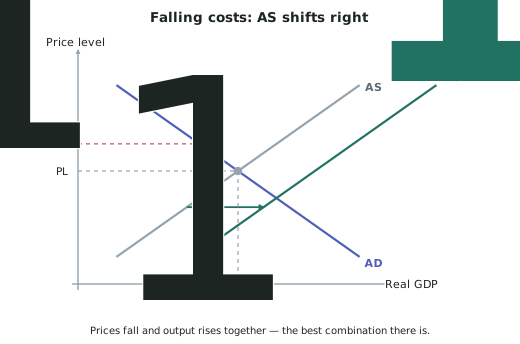
| AS right | Falls | Rises |
- Notice the pattern: when AD moves, PL and Y move the same way. When AS moves, they move in opposite directions.
The two outcomes you will meet less often are worth seeing drawn, because the exam does use them — a fall in spending, and a fall in costs:
How to annotate the model so it earns marks
- Label the original curves AS and AD, and the original equilibrium PL and Y.
- Draw the new curve clearly to the left or right of the old one and label it AD1 or AS1.
- Draw an arrow showing the direction of the shift.
- Mark the new equilibrium and label the new PL1 and Y1 on the axes.
- Only then start writing — and use those labels in your sentences.
Worked ExampleChoosing the curve and shifting it
The Reserve Bank lowers the Official Cash Rate. Retail banks reduce mortgage and business lending rates.
Explain, using the AS/AD model, the effect on New Zealand's price level and real GDP.
Step 1 — Decide which curve moves
Lower lending rates make borrowing cheaper. Households borrow and spend more, and firms borrow to invest more.
That changes and — two components of aggregate demand. So this is an AD event, not an AS event.
Step 2 — Decide the direction
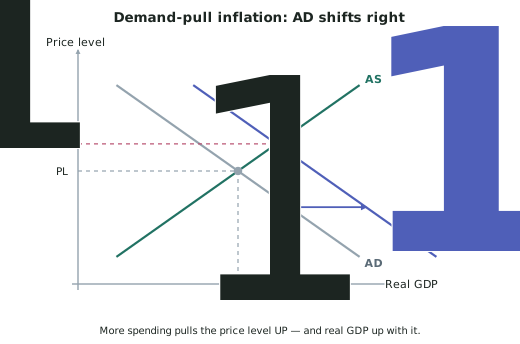
Spending increases, so AD shifts right, from AD to AD1.
Step 3 — Read the new equilibrium off the model
The new AD1 curve cuts AS further up and to the right.
- The price level rises from PL to PL1
- Real GDP rises from Y to Y1
Step 4 — Write the chain in words
Lower interest rates → cheaper borrowing → consumption and investment rise → AD shifts right to AD1 → at the new intersection with AS, the price level rises to PL1 and real GDP rises to Y1.