Expected value and standard deviation
Expected value — the mean of a random variable
- The expected value , also written , is the long-run average value of the random variable over very many repetitions.
- Read it as a weighted average: each value is weighted by how likely it is.
- The expected value need not be a possible value. The expected number of heads in 3 tosses is 1.5, and you can never observe 1.5 heads. This is not an error — it is an average, not a prediction.
Calculating it
- Work in a column, and the arithmetic stays clean:
| 0 | 0.2 | 0.0 |
| 1 | 0.5 | 0.5 |
| 2 | 0.3 | 0.6 |
| 1.0 |
- Check the probability column sums to 1 before you trust the total.
Variance and standard deviation
- The variance measures spread — how far values typically fall from the mean. The version to use is:
- The standard deviation is its square root, and it is in the same units as the variable, which is why it is the figure to quote:
- Method: build a third column of , total it, then subtract .
- Sanity checks: the variance is never negative, and the standard deviation should be comparable to the typical distance of values from the mean. If comes out larger than the whole range of the variable, you have made an error.
Interpreting the two together
- tells you where the distribution sits; tells you how spread out it is.
- In context, always give both with units and say what they mean:
- "On average the machine produces 2.4 rejects per hour, with a standard deviation of 1.3 rejects — so an hour with 4 rejects is unusual but not remarkable."
Scaling and shifting a random variable
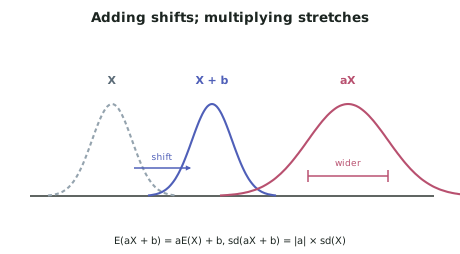
- If a new variable is built from by multiplying and adding constants, :
- Adding a constant shifts the mean but not the spread. Giving every customer $5 off raises nobody's variability.
- Multiplying scales both, but the variance scales by while the standard deviation scales by — because standard deviation is in the original units and variance is in squared units.
Adding independent random variables
- For independent and :
- Means always add. Variances add only when the variables are independent — this is where a question tests whether you have thought about the context.
- Note the trap: the variance of (two independent items) is not the same as the variance of (one item doubled).
- Two separate randomly chosen items partly cancel each other's variation; doubling one item doubles its deviation as well.
Worked ExampleExpected value, standard deviation and a decision
A food truck sells a set meal. Demand per lunchtime, meals, has this distribution:
| 20 | 30 | 40 | 50 | |
|---|---|---|---|---|
| 0.15 | 0.35 | 0.35 | 0.15 |
(a) Find and the standard deviation of . (b) Each meal sells for $14 and the truck's fixed costs are $180 per lunchtime. Let be the profit. Find and the standard deviation of . (c) The owner considers opening at a second location with an independent, identically distributed demand. Find the mean and standard deviation of total demand across both trucks, and compare with simply doubling one truck's demand.
(a) Mean and standard deviation of demand
Step 1 — Set out the columns.
| 20 | 0.15 | 3.0 | 60 |
| 30 | 0.35 | 10.5 | 315 |
| 40 | 0.35 | 14.0 | 560 |
| 50 | 0.15 | 7.5 | 375 |
| Total | 1.00 | 35.0 | 1310 |
Step 2 — Expected value.
Step 3 — Variance.
Step 4 — Standard deviation.
Interpret: demand averages 35 meals with a typical departure of about 9 meals, so lunchtimes between roughly 26 and 44 meals are ordinary. Note the distribution is symmetric, which is why the mean sits exactly at the centre.
(b) Profit
Step 1 — Express in terms of . Revenue is $14 per meal, and $180 of fixed cost is paid regardless:
This is of the form with and .
Step 2 — Expected profit.
Step 3 — Standard deviation of profit. The constant shifts but does not spread, so only the multiplier matters:
Step 4 — Interpret in context.
(c) Two independent trucks against one doubled
Step 1 — Total demand across two independent trucks. Let and be the two trucks' demands, independent and each distributed as .
Step 2 — One truck's demand doubled, for comparison.
Step 3 — Compare and explain.
Step 4 — Reflect on the business decision.