The Poisson distribution
What it models
- The Poisson distribution counts events occurring at random over an interval of time, space, or area — where there is no fixed number of trials.
- Write it as:
- where (lambda) is the mean number of events per interval.
- Typical situations: calls arriving at a helpline per hour, faults per kilometre of cable, earthquakes above a magnitude per year, weeds per square metre, customers entering a shop per ten minutes.
The conditions
| Condition | What it means | Fails when |
|---|---|---|
| Events occur at random | No pattern or schedule | Events are scheduled or triggered |
| Constant average rate | is the same throughout the interval | The rate varies by time of day or season |
| Independence | One event does not make another more or less likely | Events cluster or trigger each other |
| No simultaneous events | Events happen one at a time | Events arrive in groups |
- The rate condition and the independence condition are the two that fail in practice, and questions are built around them. Customers arriving at a café do not arrive at a constant rate across the day; aftershocks are triggered by earthquakes.
The formula and the calculator
- In practice use poissonpdf for and poissoncdf for , with the same inequality conversions as for the binomial.
- Unlike the binomial, has no upper limit — any whole number is possible, though large values become vanishingly unlikely.
Mean and standard deviation
- The mean and the variance are both . This is a distinctive property, and it gives you a quick way to check whether a Poisson model fits a data set: if the observed variance is much larger than the mean, the events are clustering and the Poisson model is wrong.
Changing the interval — the crucial skill
- is tied to a specific interval, and must be rescaled when the interval changes.
- If faults occur at 3.2 per kilometre, then over 5 km:
- If calls arrive at 12 per hour, then in 20 minutes:
- Rescale before doing anything else. Forgetting to is the single most common Poisson error, and it produces an answer that is wrong by a large factor.
Shape
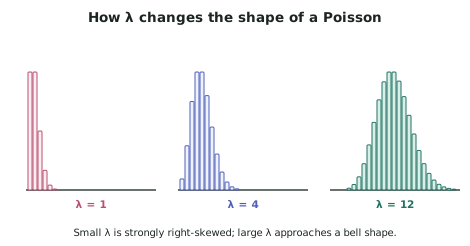
- Small → strongly right-skewed, with the peak at 0 or 1.
- Large → increasingly symmetric, approaching a normal shape.
Binomial or Poisson?
- The distinction is examined constantly. The test is simple:
| Ask | Binomial | Poisson |
|---|---|---|
| Is there a fixed number of trials? | Yes — is given | No |
| Can you count non-events? | Yes — failures | No — you cannot count the calls that did not arrive |
| What is given? | and | A rate per interval |
- The clearest test is the second one. "Of 40 seeds, how many germinate?" — you can count the 8 that did not, so it is binomial. "How many texts arrive in an hour?" — there is no way to count the texts that did not arrive, so it is Poisson.
Worked ExamplePoisson with a rescaled interval
A regional emergency call centre receives calls at an average rate of 7.2 per hour during the night shift, and calls arrive at random.
(a) State the distribution for the number of calls in one hour, and find the probability of exactly 5 calls. (b) Find the probability of more than 10 calls in one hour. (c) Find the probability of no calls in a 20-minute period. (d) The centre has two operators, each able to handle 6 calls per hour. Find the probability that a given hour brings more calls than the pair can handle, and comment. (e) Records over 120 night-shift hours give a mean of 7.2 calls per hour and a variance of 19.4. Comment on the Poisson model.
(a) One hour
(b) More than 10 calls
Step 1 — Convert the inequality. "More than 10" excludes 10:
Step 2 — Compute.
(c) A 20-minute period — rescale first
Step 1 — Rescale . Twenty minutes is one third of an hour:
Step 2 — Compute.
Note what happens if you forget to rescale: using gives , which is wrong by a factor of more than 100.
(d) Capacity
Step 1 — Find the capacity. Two operators at 6 calls per hour each handle 12 calls per hour.
Step 2 — Find the probability of exceeding it.
Step 3 — Interpret for the centre.
(e) Assessing the Poisson model against the data
Step 1 — Apply the defining property. For a Poisson distribution, the variance equals the mean:
Step 2 — Compare with the observed variance.
The observed variance is about 2.7 times the mean.
Step 3 — Conclude.
Step 4 — Explain the mechanism, since that is what earns the marks.