The triangular distribution
What it models
- The triangular distribution is used when you know three things about a quantity:
- a minimum possible value,
- a maximum possible value,
- the most likely value — the mode — , somewhere between them.
- It is the natural model when an expert estimate is all that is available: "it will take at least 3 days, at most 12, and most likely 5". No data, three judgements, one distribution.
- Typical contexts: project completion times, cost estimates, crop yields, the time to repair a fault.
The shape
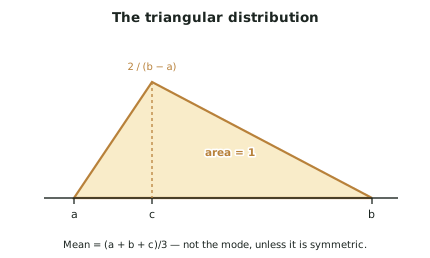
- The density is a triangle: zero at , rising to a peak at , falling back to zero at .
- Because the total area must be 1, and a triangle's area is :
- The peak height depends only on the range, not on where the mode sits. Moving the mode changes the shape but not the height.
Finding probabilities — always by area
-
There is no calculator function for this. Every triangular probability is a geometric area calculation, and the method is:
- Sketch the triangle with , , and the height marked.
- Shade the region you want.
- Decide whether it is easier to find that area directly or to find the complement and subtract.
- Use similar triangles to get the height of the density at the boundary of the region.
-
The key technique is similar triangles. For a point on the left slope (between and ), the density height there is:
- and the area to the left of is the small triangle:
- Similarly, for on the right slope (between and ), the area to the right is a small triangle:
- You do not have to memorise these. If you sketch the triangle and use similar triangles, you will derive them each time — and the specification credits the working.
A check worth doing every time
- The area to the left of the mode is:
- This tells you instantly which side of the triangle any given value falls on, and whether your answer should be above or below that figure.
Mean and standard deviation
- The mean is the average of the three parameters — a pleasingly simple result. Note that it is not the mode, unless the triangle is symmetric.
- The mean sits between the mode and the midpoint of the range, pulled towards the longer tail. If is left of centre, the distribution is right-skewed and .
Choosing the parameters
- Exam questions frequently ask you to suggest and justify parameters for a triangular model of a described situation. A good answer:
- sets and at values that are genuinely possible extremes, not at typical values
- sets at the most commonly occurring value described
- justifies each from the context, not from arithmetic convenience
- notes that the model assumes the density falls linearly from the mode to each extreme, which is an approximation.
Worked ExampleA triangular model of repair times
A telecommunications company models the time to restore service after a fault, hours, as a triangular distribution with a minimum of 1 hour, a maximum of 10 hours, and a most likely value of 3 hours.
(a) Sketch the density and find its peak height. (b) Find the probability a repair takes less than 3 hours. (c) Find the probability a repair takes less than 2 hours. (d) Find the probability a repair takes more than 6 hours. (e) Find the mean repair time and comment on why it differs from the most likely value.
(a) The density
Peak height:
Check the area: ✓
Note the triangle is strongly right-skewed — the left slope is short and steep (2 hours wide), the right slope long and shallow (7 hours wide).
(b) Less than 3 hours — the area left of the mode
This is a useful landmark: only about 22% of repairs are completed within the "most likely" time. The mode is not the median — a point worth noticing, and one part (e) develops.
(c) Less than 2 hours — on the left slope
Step 1 — Confirm which slope. , so the value is on the left slope.
Step 2 — Find the density height at using similar triangles. The left slope rises from 0 at to at , so at it has risen halfway:
Step 3 — Area of the small triangle from 1 to 2.
Check with the formula:
(d) More than 6 hours — on the right slope
Step 1 — Confirm which slope. , so it is on the right slope, and the region to the right is a small triangle.
Step 2 — Density height at . The right slope falls from at to 0 at , a run of 7. At we are 4 units from the far end:
Step 3 — Area of the triangle from 6 to 10.
Check with the formula:
Note the contrast with (c). The chance of a repair running over 6 hours (25%) is more than four times the chance of one finishing inside 2 hours (5.6%), despite 2 being closer to the mode. That asymmetry is the whole point of using a skewed model.
(e) Mean repair time
Why it exceeds the most likely value of 3 hours:
Why this matters in context: