The binomial distribution
What it models
- The binomial distribution counts the number of successes in a fixed number of trials.
- Write it as:
- where is the number of trials and is the probability of success on each trial.
- "Success" simply means the outcome being counted — it need not be a good thing. Counting faulty items makes "faulty" the success.
The four conditions
- These must all hold, and questions very often turn on one of them failing. Learn them as a checklist:
| Condition | What it means | Fails when |
|---|---|---|
| Fixed | The number of trials is decided in advance | You keep going until something happens |
| Two outcomes | Each trial is a success or a failure | There are three or more categories |
| Constant | The probability is the same on every trial | Conditions change; sampling without replacement from a small population |
| Independence | Trials do not affect each other | A shared cause links the trials |
- Stating which condition fails, and why, is worth more than any calculation. This is the most reliable place to earn Merit and Excellence marks in this topic.
The formula and the calculator
- counts the number of ways to get successes among trials.
- In practice you use your calculator's binomial pdf for and binomial cdf for . The specification expects a graphing calculator.
| Wanted | Calculator |
|---|---|
| binompdf | |
| binomcdf | |
| binomcdf | |
| binomcdf | |
| binomcdf | |
| binomcdf binomcdf |
Mean and standard deviation
- Both are given in the Formulae and Tables Booklet.
- Use as a sanity check on every binomial answer. If and , the mean is 4 — so a calculated ought to be small. An answer that contradicts this signals a data-entry error.
Shape
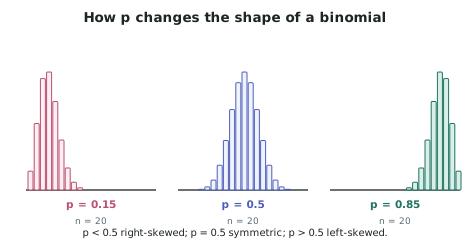
- → right-skewed. → symmetric. → left-skewed.
- The larger becomes, the more the shape approaches a normal curve — which is why a normal model can approximate a binomial with large .
Sampling without replacement
- Strictly, drawing without replacement makes change between trials, so the binomial does not apply.
- In practice, if the sample is a small fraction of the population (a common rule of thumb is under 10%), the change in is negligible and the binomial is an acceptable approximation.
- Say this explicitly when it applies: "Sampling 20 from 5 000 changes negligibly, so a binomial model is reasonable."
Worked ExampleBinomial calculations and checking the conditions
A vineyard's bottling line has a 7% rate of under-filled bottles. A quality inspector takes a random sample of 30 bottles from a day's production of about 8 000.
Let be the number of under-filled bottles in the sample.
(a) State the distribution of and justify that a binomial model is appropriate. (b) Find the probability that exactly 2 bottles are under-filled. (c) Find the probability that at least 4 bottles are under-filled. (d) Find the mean and standard deviation of , and comment on whether finding 6 under-filled bottles would be surprising. (e) The inspector instead decides to keep testing bottles until she finds 3 under-filled ones, and record how many she tested. Explain why a binomial model does not apply.
(a) The distribution and its conditions
Check all four conditions:
- Fixed ✓ — the inspector decided in advance to test 30 bottles.
- Two outcomes ✓ — each bottle is either under-filled or not.
- Constant ✓ (approximately) — the sample of 30 is drawn without replacement, but from about 8 000 bottles, so the sample is under 0.4% of production and the probability changes negligibly from bottle to bottle.
- Independence ✓ (assumed) — whether one bottle is under-filled does not affect another, provided the filling machine's behaviour is stable across the day.
(b) Exactly 2 under-filled
(c) At least 4 under-filled
Step 1 — Convert the inequality.
Step 2 — Compute.
Note the off-by-one: using binomcdf at 4 would have given and an answer of 0.037 — a very different figure.
(d) Mean, standard deviation, and judging 6
Step 1 — Mean.
Step 2 — Standard deviation.
Step 3 — Judge 6 under-filled bottles.
Step 4 — Interpret for the vineyard.
(e) Why the redesigned sampling is not binomial
Step 1 — Test the conditions.
Step 2 — Identify what is now the random variable.
Step 3 — Conclude.