Distance–time and velocity–time graphs
Key ideas
Graphs turn motion into pictures, and two rules unlock all of them:
- On a distance–time graph, the gradient is the velocity.
- On a velocity–time graph, the gradient is the acceleration, and the area under the graph is the distance travelled.
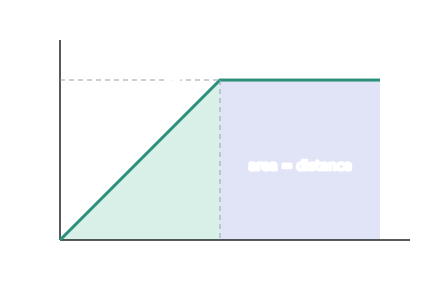
A runner accelerates uniformly from rest to m s⁻¹ in s, then holds that velocity for another s (the graph above). Find the acceleration in the first phase and the total distance.
Step 1 — Acceleration = gradient of the first phase
Step 2 — Distance = area under the whole line
Split the shape into a triangle (rising phase) plus a rectangle (steady phase):
Reading the shape
| Graph | Flat (horizontal) means | Straight slope means | Curve means |
|---|---|---|---|
| distance–time | stationary | constant velocity | accelerating |
| velocity–time | constant velocity | constant acceleration | changing acceleration |
Practice question
A car's velocity–time graph shows a straight line from m s⁻¹ down to in s. How far does it travel while stopping?
Worked solution: area under the line is a triangle: m.
Test yourself
Practice by grade
One question each at Achieved, Merit and Excellence. Have a go, then compare with the model answer.
A car's velocity–time graph is a horizontal line at m s⁻¹ for s.
State what the area under the line represents, and calculate the distance the car travels.
A cyclist's velocity–time graph rises in a straight line from 0 to m s⁻¹ in s, then stays at m s⁻¹ for a further s.
Calculate the total distance travelled.
A car accelerates uniformly from rest, then travels at a constant velocity, then brakes steadily to a stop.
Describe and explain, using physics principles, what the gradient and the area of a velocity–time graph tell you about each of these three phases.