The four goals and the indicators that measure them
Why the goals come first
- The standard requires an explanation of "the current state of the New Zealand economy in relation to macro-economic goals" at Achieved level.
- Every question in this paper eventually asks "what does this do to goal X", so you must be able to name all four and say how each is measured.
Goal 1 — Price stability
- Price stability means low and stable inflation, not zero inflation.
- Inflation is a sustained increase in the general level of prices, measured as a percentage change over a year.
- Measured by: the Consumers Price Index (CPI), published quarterly by Stats NZ.
- The target: the Reserve Bank of New Zealand (RBNZ) is required to keep annual CPI inflation between 1% and 3%, with a focus on the 2% midpoint.
- The target is set out in the Remit issued under the Reserve Bank of New Zealand Act 2021. The older name, the Policy Targets Agreement (PTA), still appears in exam resource material and in the Assessment Reports, so recognise both.
- "Did not state the PTA" is a 2025 Not Achieved bullet. Know the number: 1–3%.
Goal 2 — Economic growth
- Economic growth is an increase in real GDP — the total value of goods and services produced, adjusted for inflation.
- Real matters: nominal GDP can rise purely because prices rose. Only real GDP measures more actual output.
- Measured by: real GDP, published quarterly by Stats NZ, usually quoted as an annual percentage change.
- Sustainable growth is growth that does not exhaust resources or damage the environment for future generations. Level 3 questions often ask for it explicitly.
Goal 3 — Full employment
- Full employment does not mean zero unemployment. It means the lowest sustainable rate, where the only unemployment left is people between jobs or retraining.
- Measured by: the unemployment rate from the Household Labour Force Survey (HLFS), published quarterly by Stats NZ.
- Unemployment rate = unemployed ÷ labour force × 100.
- The labour force is the employed plus the unemployed — people who are actively seeking and available for work. It excludes students, retirees and those not looking.
- On the AD/AS model, full employment is the vertical line Yf. Every AD/AS diagram in this standard must have it.
Goal 4 — A balanced current account
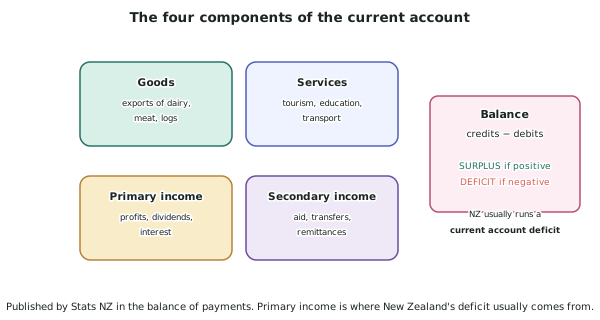
- The current account records New Zealand's transactions with the rest of the world in four components:
-
Goods — exports of dairy, meat and logs against imports of vehicles, machinery and fuel.
-
Services — tourism and international education earnings against overseas travel and freight paid.
-
Primary income — profits, dividends and interest. Money earned by New Zealanders overseas against money paid to overseas owners of New Zealand assets.
-
Secondary income — transfers with nothing given in return: aid, remittances.
-
Balance = credits − debits. Positive is a surplus, negative is a deficit.
-
Measured by: the balance of payments, published quarterly by Stats NZ, usually quoted as a percentage of GDP.
-
New Zealand usually runs a current account deficit, and primary income is normally the largest contributor, because a lot of New Zealand business is overseas-owned so profits flow out.
Where the economy is: the business cycle
-
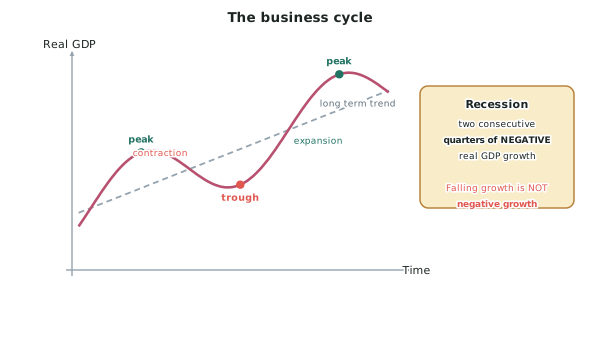
The business cycle is the pattern of real GDP rising and falling around its long-term trend.
-
Peak — the top of a cycle. Growth is strong, unemployment is low, inflation pressure is high.
-
Contraction — real GDP growth is falling.
-
Trough — the bottom. Unemployment is high, inflation pressure is low.
-
Expansion / recovery — real GDP is rising again.
-
A recession is defined as two consecutive quarters of negative real GDP growth.
-
Falling growth is not negative growth. If growth slows from 3% to 1%, the economy is still growing, just more slowly. The 2024 report says "many candidates did not note the difference between declining and negative growth".
The goals conflict
- Growth against price stability: faster growth means more spending, which pushes the price level up.
- Full employment against a balanced current account: more people in work means more income, and New Zealanders spend a share of extra income on imports, which worsens the current account.
- No government can maximise all four at once, and that tension is what the Excellence questions in this standard are built on.
Worked ExampleDescribing the state of the economy from indicators
The illustrative indicators below are for a hypothetical economy.
| Indicator | Two years ago | Last year | This year |
|---|---|---|---|
| Annual CPI inflation | 6.4% | 4.1% | 2.2% |
| Annual real GDP growth | 3.1% | 0.8% | −0.3% |
| Unemployment rate | 3.4% | 4.2% | 5.1% |
| Current account balance (% of GDP) | −8.2% | −6.9% | −5.4% |
Describe the current state of this economy in relation to each of the four macro-economic goals, and state where it sits on the business cycle.
Step 1 — Price stability
Annual inflation has fallen from 6.4% to 2.2%.
The rate is still positive, so prices are still rising — this is disinflation, not deflation. But at 2.2% inflation is now inside the 1–3% target band and close to the 2% midpoint.
The goal of price stability is being met.
Step 2 — Economic growth
Real GDP growth has fallen from 3.1% to 0.8% and now to −0.3%.
The move from 3.1% to 0.8% is declining growth — the economy was still growing, just more slowly. The move to −0.3% is different: this is negative growth, meaning real GDP has actually contracted.
The goal of economic growth is not being met. If the next quarter is also negative, the economy meets the definition of a recession — two consecutive quarters of negative real GDP growth.
Step 3 — Full employment
Unemployment has risen from 3.4% to 5.1%.
This is consistent with the contraction in real GDP: firms producing less need fewer workers, so employment falls and unemployment rises. On the AD/AS model this economy has moved further left of Yf, opening a recessionary gap.
The goal of full employment is moving away from being met.
Step 4 — Balanced current account
The current account deficit has narrowed from −8.2% to −5.4% of GDP.
The goal of a balanced current account is moving towards being met — but note why. As incomes fall and unemployment rises, New Zealanders have less to spend, and a share of every dollar of spending goes on imports. Falling incomes therefore reduce import payments, which narrows the deficit.
The improvement is a symptom of the downturn, not an independent success.
Step 5 — Position on the business cycle
Real GDP growth has turned negative, unemployment is rising and inflation pressure has eased. Taken together these place the economy in a contraction, heading towards a trough.
Step 6 — Note the conflict
Two goals have improved and two have worsened, and they are linked. The same fall in spending that brought inflation back inside the band and narrowed the current account deficit is what caused real GDP to contract and unemployment to rise.
This is the central tension of the standard: policies and events that help one goal frequently damage another.