Aggregate demand, aggregate supply and the gaps
The two curves
- Aggregate demand (AD) is the total spending on New Zealand-produced goods and services at each price level.
AD = C + I + G + (X − M)
-
C — consumption by households
-
I — investment by firms in capital goods
-
G — government spending
-
(X − M) — net exports: export receipts minus import payments
-
Aggregate supply (AS) is the total output firms are willing to produce at each price level.
-
The axes are price level (vertical) and real GDP (horizontal). Never "price" and "quantity" — those are the microeconomic labels.
The shape of the AS curve, and why it matters
- AS is flat at low output and steep near capacity. This shape does real work in every answer.
- At low output there is spare capacity — idle machinery, unemployed workers — so firms can produce more without bidding up wages or input prices. The price level barely moves.
- Near capacity there is no spare capacity, so firms competing for the same scarce resources bid prices up sharply. Output barely moves.
- The 2025 report lists "recognised characteristics of the AS curve and identified areas of spare capacity" as an Excellence bullet.
Yf and the two gaps
- Yf is the full employment level of real GDP — the output the economy produces when all resources are fully used. It is drawn as a vertical line.
- Every AD/AS diagram in this standard must have Yf, because without it you cannot discuss employment.
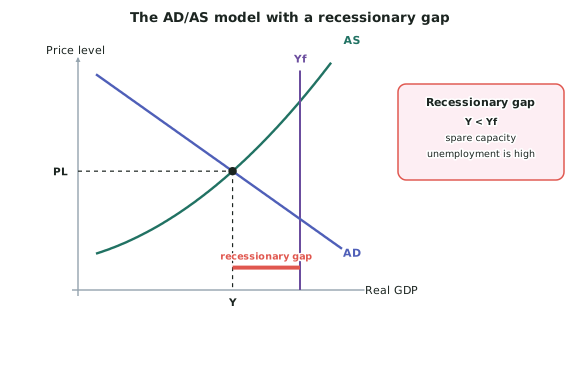
Recessionary gap — equilibrium Y is to the LEFT of Yf.
- The economy is producing less than it could.
- There is spare capacity and unemployment is high.
- The gap is the horizontal distance Yf − Y.
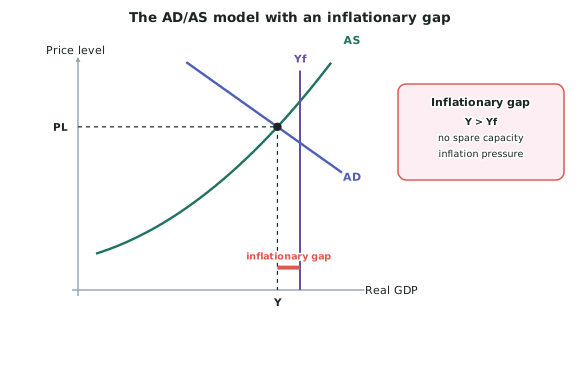
Inflationary gap — equilibrium Y is to the RIGHT of Yf.
- The economy is producing beyond its sustainable capacity.
- Resources are stretched, and there is strong upward pressure on the price level.
What shifts AD
- Anything that changes C, I, G or (X − M):
- C — a change in interest rates, income, confidence, wealth or taxation.
- I — a change in interest rates, business confidence or expected profitability.
- G — a government decision to spend more or less.
- (X − M) — an overseas recession, a free trade agreement, a change in the exchange rate.
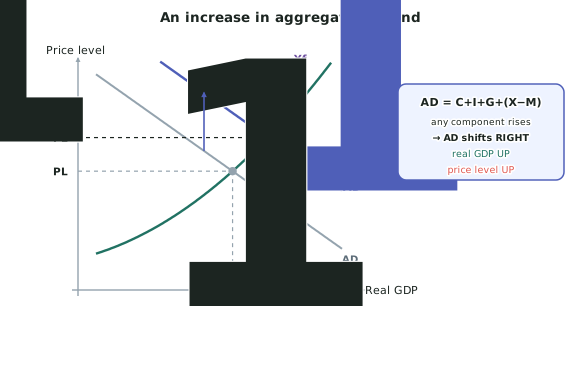
- AD shifts right: real GDP rises and the price level rises.
- AD shifts left: real GDP falls and the price level falls.
What shifts AS
- Anything that changes costs of production or productive capacity:
- Wage rates, imported raw material prices, fuel prices, the exchange rate, taxes on business.
- Productivity, technology, infrastructure, skills, net migration.
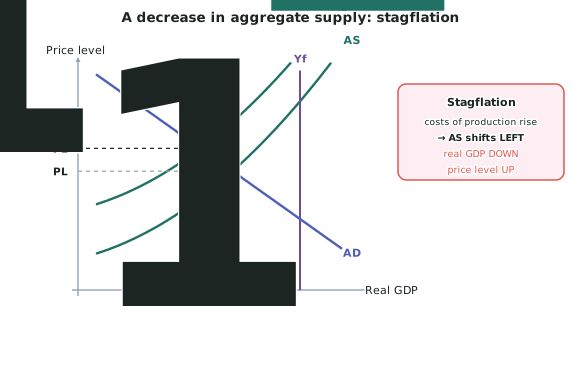
- AS shifts left (costs rise): real GDP falls and the price level rises — this combination is stagflation, and it is the worst outcome because two goals worsen at once.
- AS shifts right (costs fall or capacity grows): real GDP rises and the price level falls — both goals improve at once, which is why supply side policies are attractive.
Worked ExampleHigher net migration on the AD/AS model
Net migration into New Zealand increases sharply.
Using the AD/AS model, explain the impact on the goals of economic growth and price stability.
Step 1 — Identify which curve or curves move
Migration affects both curves, and a full answer must say so.
Aggregate demand — more people in New Zealand means more households buying food, housing, transport and services, so consumption (C) rises. Firms respond to the larger market by expanding, so investment (I) rises too. Government spending on health and education rises with the population, so G rises. AD shifts right to AD1.
Aggregate supply — migrants add to the labour force, and many bring skills and qualifications. A larger and more skilled workforce increases the economy's productive capacity, so firms can produce more at any given price level. AS shifts right to AS1.
Step 2 — Take the AD effect on its own
With AD shifting right and AS held still:
- Real GDP rises from Y to a higher level — the goal of economic growth is served.
- The price level rises from PL to a higher level — the goal of price stability is threatened.
The size of the price rise depends on where the economy sits on the AS curve. If there is a large recessionary gap with plenty of spare capacity, the flat section of AS means real GDP rises a lot and the price level barely moves. If the economy is near Yf with no spare capacity, the steep section means the price level rises sharply and real GDP barely moves.
Step 3 — Take the AS effect on its own
With AS shifting right and AD held still:
- Real GDP rises — the goal of economic growth is served again.
- The price level falls — the goal of price stability is served.
Note that Yf itself shifts right, because the economy's full employment output is now higher with a larger labour force.
Step 4 — Combine them
Real GDP — both shifts push it the same way, so real GDP definitely rises. The goal of economic growth is served, unambiguously.
Price level — the two shifts push it in opposite directions. The AD increase pushes it up; the AS increase pushes it down. The net effect is ambiguous and depends on which shift is larger.
Step 5 — Judge which dominates, and when
The AD effect is immediate: a migrant arriving this month rents a house and buys groceries this month.
The AS effect is slower: it takes time to find a job matched to their skills, and longer still for firms to build the extra capacity to employ them productively.
In the short run, therefore, the AD shift usually dominates, so the price level rises and inflation pressure builds. This is why a migration surge often shows up first in housing costs, where supply is especially slow to respond.
In the longer run, as the AS effect works through, the price pressure eases and the economy settles at a higher real GDP with a higher Yf.
Step 6 — Link to policy
Because the short-run effect is inflationary, a migration surge is one of the influences the RBNZ watches when deciding the OCR. If it judges that migration is pushing inflation above the 1–3% band, it may raise the OCR to reduce C and I and pull AD back.