The statistical enquiry cycle
What the cycle is
- Every statistical investigation — and therefore every report about one — moves through five stages. The standard calls this the statistical enquiry cycle, and evaluating a report means checking each stage in turn.
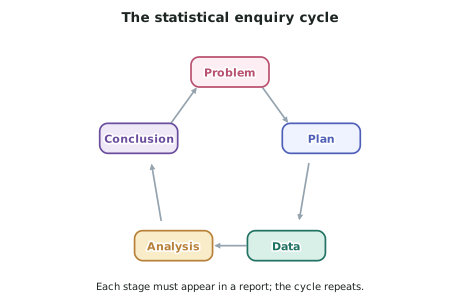
| Stage | The question it answers |
|---|---|
| Problem | What are we trying to find out, and about whom? |
| Plan | How will we collect data that can answer it? |
| Data | What did we actually collect, and what went wrong? |
| Analysis | What do the data show? |
| Conclusion | What can we now say — and how sure are we? |
- A report is only as strong as its weakest stage. A beautifully analysed data set collected from a biased sample answers nothing.
Stage 1 — Problem
- The investigative question must name a population and a variable.
- Weak: "Are New Zealanders healthy?"
- Strong: "What proportion of New Zealand adults aged 18–64 meet the physical activity guidelines?"
- Check the report's question is answerable with data and that it matches the conclusion drawn at the end.
- A very common report flaw: the question asks about all New Zealanders, but the conclusion is drawn about the sample only — or the reverse, which is worse.
Stage 2 — Plan
- The plan sets the study type, the sampling method and the sample size.
- Ask three things:
- Who could have been selected? That is the sampling frame.
- How were they selected? Random, or not.
- How were the data to be collected? Face-to-face, online, phone, measurement.
- The plan is where bias is designed in, long before anyone analyses anything. Most Excellence-level criticisms live here.
Stage 3 — Data
- Ask what the report says about what actually happened rather than what was intended.
- Response rate — of the people approached, how many replied? A 20% response rate makes a "random sample" effectively self-selected.
- Missing data — were people who did not answer a question simply dropped?
- Measurement — was the variable measured or self-reported? Self-reported exercise, income and alcohol consumption are all systematically inaccurate.
Stage 4 — Analysis
- Check that the display suits the data and that the summary statistics are the right ones.
- Ask whether the comparison being made is fair — same time period, same definition, same population.
- Watch for a report that shows you counts when the honest comparison needs rates.
Stage 5 — Conclusion
- The conclusion must be no stronger than the design allows:
- An observational study supports "is associated with".
- A randomised experiment supports "causes".
- A sample supports a statement about the population it was drawn from, and no other.
- The conclusion must also acknowledge uncertainty — a poll estimate without a margin of error is an overstatement.
Using the cycle in the exam
- When a question says "evaluate this report", the cycle is your checklist. Work through it and you will not run out of things to say.
- Comment only on features relevant to the report's conclusion. EN2 is explicit about this: features "relevant to conclusions made in those reports". A true but irrelevant observation earns nothing.
Worked ExampleEvaluating a report against the enquiry cycle
A regional council publishes this summary.
"We emailed our ratepayer newsletter list and asked, 'Do you support the proposed cycleway on Marine Parade?' Of the 1 240 people who replied, 71% said yes. A clear majority of residents support the cycleway, so the project will proceed."
Using the statistical enquiry cycle, identify two weaknesses and explain what each means for the council's conclusion.
Step 1 — Identify the population in the conclusion, and the one actually studied
The conclusion is about residents. The people who could possibly have been selected were ratepayers on the council's newsletter mailing list.
Those are not the same group. Renters are ratepayers' tenants, not ratepayers, and they are excluded entirely — yet they live on the route and are plausibly more likely to cycle. Anyone not subscribed to the newsletter is also excluded.
Step 2 — Ask how the respondents came to be respondents
Nobody was selected. The council contacted everyone on the list and whoever chose to reply, replied.
This is a self-selected (voluntary response) sample. People with strong feelings — in either direction, but especially those campaigning for the cycleway — are far more likely to spend the time replying than people who are indifferent.
Step 3 — Say what this does to the conclusion
Both weaknesses push in the same direction: the sample over-represents engaged, motivated, property-owning subscribers.