Populations, sampling frames and the gap between them
The four groups you must keep apart
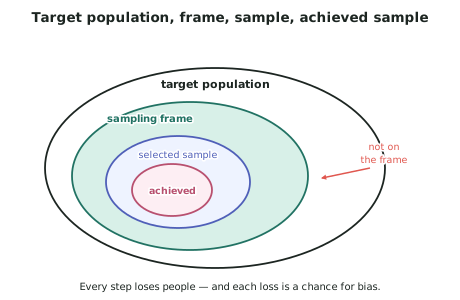
-
The target population is the group the conclusion is about — everyone the report wants to talk about.
-
The sampling frame is the list or mechanism from which people could actually be selected.
-
The selected sample is who was chosen from the frame.
-
The achieved sample is who actually provided data.
-
Each arrow between these loses people, and each loss is a chance for bias. Evaluating a report largely means finding out who was lost and whether they differed from those who stayed.
Undercoverage — the frame misses part of the population
- Undercoverage happens when part of the target population has no chance of being selected.
- Classic New Zealand examples:
- A frame of landline numbers misses households that are mobile-only, which skew younger, more urban and more transient.
- A frame of the electoral roll misses those not enrolled — disproportionately young people, recent migrants and people without stable addresses.
- A frame of ratepayers misses renters entirely.
- An online panel misses people with poor internet access — often older, rural or low-income.
- Undercoverage matters only if the missing group differs on the variable being measured. Missing left-handed people from a survey about voting intention would not matter; missing renters from a survey about housing costs is fatal.
Over-coverage — the frame includes people it should not
- Over-coverage is the opposite: the frame contains units that are not in the target population.
- A school's full enrolment database used to survey current students still contains those who have left.
- A customer list used to survey New Zealand customers includes overseas ones.
- Over-coverage is usually less damaging than undercoverage, because those people can be screened out — but only if the report says it did so.
Parameters and statistics
- A parameter is the true value for the whole population. It is fixed, and almost always unknown.
- A statistic (or estimate) is the value calculated from the sample. It changes from sample to sample.
- Notation you should be comfortable reading:
| Quantity | Population parameter | Sample statistic |
|---|---|---|
| Mean | ||
| Proportion | ||
| Standard deviation |
- A report's number is always a statistic. Whenever a report states a figure as though it were the truth — "43% of New Zealanders support X" — the honest version is "we estimate 43%, give or take a margin of error".
Sampling variability
- Sampling variability is the fact that two different random samples from the same population give different estimates, purely by chance.
- It is not an error. Nobody did anything wrong; it is an unavoidable consequence of not measuring everyone.
- Two consequences you are expected to state:
- Larger samples vary less. Estimates from big samples cluster more tightly around the true value.
- Sampling variability is the only thing the margin of error measures. It says nothing about bias.
Bias versus variability — the distinction that carries the standard
- Sampling variability is random scatter around a value. Bias is the value being systematically wrong.
| What it is | Fixed by a bigger sample? | |
|---|---|---|
| Sampling variability | Random differences between samples | Yes — it shrinks as grows |
| Bias | A systematic tilt built into the method | No — a bigger biased sample is just a more precise wrong answer |
- This is the single most valuable idea in the standard. A report that boasts about a huge sample has told you it has small sampling variability, and nothing at all about whether it is biased.
Target population versus study population
- Reports often quietly narrow the population between the introduction and the conclusion. When you evaluate, write down the population named in the conclusion, then write down who was eligible to be sampled, and compare them.
- If they differ, you have found a criticism worth developing — and it is usually the strongest one available.
Worked ExampleTarget population, frame, and what is lost at each step
Stats NZ-style household survey. A researcher wants to estimate the proportion of New Zealand adults aged 18 and over who have delayed a doctor's visit because of cost in the past 12 months.
She draws a random sample of 2 000 residential addresses from a national address register, mails a questionnaire to each, and receives 900 completed responses.
(a) Identify the target population, the sampling frame, the selected sample and the achieved sample. (b) Identify one group likely to be under-represented, and state the likely effect on the estimate. (c) The researcher says "a random sample of 2 000 was used, so the results are unbiased." Comment on this statement.
(a) The four groups
Note that the frame is a list of addresses, not of adults — an extra mismatch worth noticing, since households vary in size and a one-questionnaire-per-address design gives an adult in a six-person flat a much smaller chance of being heard than an adult living alone.
(b) Who is under-represented, and which way it pushes the estimate
Step 1 — Ask who has no address on the register. People without stable housing — those in emergency accommodation, temporary or transient living situations, or sleeping rough — are not on a residential address register at all. They have zero chance of selection: this is undercoverage, not just non-response.
Step 2 — Ask whether that group differs on the variable being measured. This is exactly the group most likely to have delayed a doctor's visit because of cost. The missing people sit at the extreme of the variable being estimated.
Step 3 — State the direction.
Step 4 — Add the non-response layer. Only 900 of 2 000 responded — a 45% response rate. Completing and posting a written questionnaire takes time, literacy and a stamp, so response is likely to be lower among people under financial stress. This pushes the estimate further in the same direction.
(c) Evaluating the "random sample, therefore unbiased" claim
Step 1 — Give the researcher what she is entitled to. Random selection from the frame does remove selection bias within the frame — no interviewer chose who to approach, and every listed address had a known, equal chance.
Step 2 — Name what random selection cannot do. Randomness operates inside the frame only. It cannot repair a frame that omits part of the population, and it cannot make people reply.
Step 3 — Separate the two ideas.