What a margin of error is and what it covers
The idea
- A sample gives an estimate, and a different sample would have given a different estimate. The margin of error says how far the estimate could plausibly be from the population value because of sampling variability alone.
- The standard convention, used by every published poll, is a 95% margin of error: in about 95 of every 100 samples, the interval "estimate ± margin of error" contains the true population value.
The approximation you are expected to use
- For a percentage estimated from a random sample of size , the approximate 95% margin of error is:
- Expressed as a percentage, multiply by 100.
- This is the maximum margin of error, and it applies exactly when the percentage is near 50%. For percentages far from 50% the true margin of error is smaller — which is why a party on 4% is measured more precisely than a party on 48%.
The square-root law
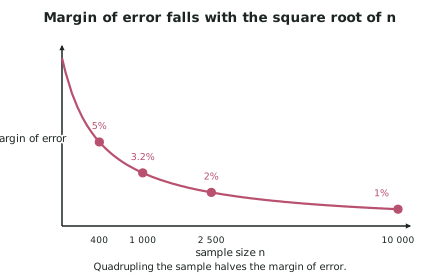
- Because appears under a square root, precision improves slowly:
- To halve the margin of error you must quadruple the sample size.
- Going from to improves the margin of error only from 3.2% to 2.2%.
- This is why polls stop at about 1 000. The cost doubles, and the precision improves by one percentage point. It is a deliberate economic choice, not carelessness — a useful point to make when a report is criticised for its sample size.
- Population size is irrelevant. A sample of 1 000 gives the same margin of error whether the population is 100 000 or 5 million. Students find this counter-intuitive; it is nonetheless true, and reports that say "only 1 000 people out of 5 million" are making a mistake you can name.
What the margin of error covers — and does not
| Source of error | Covered by the margin of error? |
|---|---|
| Different random samples give different estimates | Yes |
| Undercoverage of part of the population | No |
| Non-response | No |
| Leading or ambiguous questions | No |
| Respondents not telling the truth | No |
| Data entry and processing mistakes | No |
- Everything below the first line is non-sampling error, and the margin of error makes no allowance for any of it.
- This is the single most examined idea on this page. A poll's ±3.1% is an honest statement about one source of error and silence about five others.
Reading a margin of error in context
- If a report says "43%, margin of error 3.1%", the correct reading is:
We estimate 43%. Values between roughly 39.9% and 46.1% are consistent with what we observed. We are using a method that captures the true value about 95% of the time.
- Statements to avoid, because they are wrong:
- "There is a 95% chance the true value is between 39.9% and 46.1%." The true value is fixed; it is the interval that varies from sample to sample.
- "95% of people gave an answer in that range." The interval is about the estimate, not about individuals.
- "The result is accurate to within 3.1%." Only the sampling part of the error is.
Margins of error for other quantities
- Reports also quote margins of error for means (average income, average waiting time). The rule is for percentages only — a mean's margin of error depends on the spread of the data as well as .
- If a report gives a margin of error for a mean, use the number it gives; do not try to recompute it with .
Worked ExampleCalculating and interpreting a margin of error
A national survey of 625 randomly selected New Zealand households finds that 52% have a pet.
(a) Calculate the approximate 95% margin of error and state the confidence interval. (b) The report concludes: "A majority of New Zealand households have a pet." Comment on whether the data support this. (c) The researchers want to halve the margin of error. What sample size would they need, and what does that suggest about the cost of precision?
(a) Margin of error and interval
Step 1 — Apply the formula.
Step 2 — Build the interval.
(b) Does this support "a majority"?
Step 1 — Identify what "a majority" requires. A majority means the true proportion is above 50%.
Step 2 — Check where 50% sits relative to the interval. The interval runs from 48% to 56%, and 50% lies inside it.
Step 3 — State the conclusion properly.
Note how little the sample estimate being above 50% counts for on its own. The estimate exceeding a threshold is not evidence that the population value does — that is the whole reason margins of error are published.
(c) Halving the margin of error
Step 1 — Set up what is required. We want .
Step 2 — Compare with the original.
Step 3 — Interpret the cost.