Critiquing causal-relationship claims
The claim to watch for
- Critiquing causal-relationship claims is named explicitly in the standard's explanatory notes, and it appears in nearly every paper.
- The claim takes many forms. Learn to hear all of them as the same thing:
- "X causes Y", "X leads to Y", "X reduces Y"
- "X boosts, drives, triggers, protects against, damages Y"
- "Y is down to X"
- and the sly version: a headline saying "causes" over a study that only found an association.
The four rival explanations
- When a report observes that X and Y go together and claims X causes Y, there are always four alternatives to rule out. Working through them in order is the most reliable way to structure an answer.
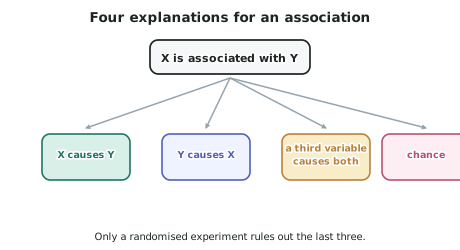
- 1. Chance. With enough variables compared, some will appear related by coincidence. Ask whether the finding was predicted in advance or found by searching the data.
- 2. Reverse causation. Y causes X rather than the other way round. Always plausible when both are measured at the same time.
- 3. Confounding. A third variable Z causes both X and Y, creating an association between them with no direct link at all.
- 4. Causation. Only left standing once the other three have been addressed.
Confounding in detail
-
A confounding variable is one that is:
- associated with the explanatory variable, and
- independently affects the response variable.
-
Both conditions must hold. Naming a variable that fails one of them is a common way to lose a mark.
-
Worked mini-example. Ice cream sales and drowning rates rise together.
- Explanatory: ice cream sales. Response: drownings.
- Confounder: hot weather. It increases ice cream sales, and independently it puts more people in the water.
- Both conditions hold, so the association needs no direct link.
-
Good practice when naming a confounder in an answer:
- Name it specifically — "household income", not "other factors".
- Say how it relates to X — higher income makes X more likely.
- Say how it independently affects Y — higher income also improves Y through a different route.
Other traps that produce false causal claims
- Regression to the mean. An unusually extreme measurement tends to be followed by a less extreme one, with or without intervention. Programmes targeted at the worst-performing schools, the highest-crime suburbs or the sickest patients will show improvement for this reason alone.
- The ecological fallacy. A relationship that holds between groups need not hold between individuals. Regions with more doctors per head may have higher recorded illness — that says nothing about whether an individual seeing a doctor makes them ill.
- Survivorship. Studying only successes: "80% of successful founders dropped out of university" tells you nothing without the dropout rate among unsuccessful founders.
- Selection into the exposure. People who take up a health programme are already health-conscious — the decision to take part is itself caused by the confounder.
When a causal claim from observational data is reasonable
- Being able to say when the causal case is strong is what separates a genuinely critical answer from a reflexive one.
- The case strengthens when:
- the association is large and consistent across many different studies and populations
- there is a dose–response relationship — more exposure, more effect
- the time order is established by longitudinal data
- there is a plausible mechanism explaining how X would cause Y
- the obvious confounders have been measured and adjusted for, and the association survives
- removing the exposure reduces the outcome.
- Smoking and lung cancer was established this way, without a randomised trial on humans ever being conducted or being ethically possible.
Worked ExampleWorking through the four explanations
A report states:
"Analysis of data from 180 New Zealand secondary schools found that schools where more students play a musical instrument have significantly higher NCEA pass rates. Learning an instrument improves academic achievement, so schools should invest in music programmes."
Critique the causal claim.
Step 1 — Identify the variables and the study type
- Explanatory variable: the proportion of students playing a musical instrument.
- Response variable: the school's NCEA pass rate.
- Study type: observational, using existing school-level data. No school was allocated a music programme.
Note immediately that both variables are measured at the level of the school, not the student. This will matter.
Step 2 — Chance
With 180 schools and presumably many variables available, some associations will appear by coincidence.
Step 3 — Reverse causation
Could high pass rates cause instrument playing?
Step 4 — Confounding — the strongest alternative
Confounder: the socioeconomic profile of the school community.
- Link to the explanatory variable: learning an instrument typically requires an instrument, paid tuition and transport to lessons. Schools serving wealthier communities have far higher rates of instrument playing.
- Independent link to the response variable: household income independently predicts NCEA achievement through access to devices, quiet study space, tutoring, stable housing, and lower need for part-time work.
A second confounder: school resourcing. A school with the staffing and budget for a music programme also has smaller classes, more subject choice and more specialist teachers — all of which independently raise pass rates.
Step 5 — The ecological fallacy
The data are school-level averages, but the conclusion is about individual students.