Sampling methods and what each one buys you
Probability sampling versus non-probability sampling
- A probability sample gives every member of the frame a known, non-zero chance of selection. Only probability samples justify a margin of error.
- A non-probability sample does not. The selection depends on convenience, on the interviewer, or on the participant volunteering.
- A margin of error quoted for a non-probability sample is meaningless, because the arithmetic behind it assumes random selection. Reports do this constantly, and saying so is a strong criticism.
The probability methods
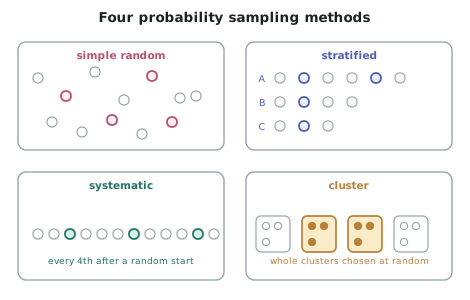
- Simple random sample — every member of the frame has an equal chance, and every possible sample of that size is equally likely.
- Buys: no selection bias within the frame; the simplest margin-of-error arithmetic.
- Costs: needs a complete list; can be expensive to reach a scattered sample.
- Stratified sample — the frame is split into strata (groups known to differ, such as age band, region or school decile), and a random sample is taken within each stratum, usually in proportion to its size.
- Buys: guarantees each stratum is represented; reduces sampling variability compared with a simple random sample of the same size, because a badly unbalanced sample becomes impossible.
- Costs: you must know the strata sizes in advance.
- Systematic sample — order the frame and take every -th unit after a random start.
- Buys: easy to carry out with no list in advance (every 10th shopper through a door).
- Costs: fails badly if the list has a repeating pattern matching — sampling every 7th day gives you the same weekday every time.
- Cluster sample — divide the population into clusters (schools, suburbs, flights), randomly select whole clusters, and survey everyone in them.
- Buys: far cheaper when the population is geographically spread.
- Costs: people within a cluster are similar to each other, so a cluster sample of carries more sampling variability than a simple random sample of .
The non-probability methods
- Convenience sample — whoever is easiest to reach.
- Anyone in the food court at midday, students in the researcher's own class.
- Voluntary response (self-selected) sample — the participants choose themselves.
- Phone-ins, online polls on news sites, "click here to have your say", reply-paid questionnaires with no follow-up.
- Systematically over-represents people with strong opinions, and usually negative ones — complaint is a stronger motivator than satisfaction.
- Quota sample — the interviewer must fill fixed quotas (say 50 men, 50 women) but chooses who within each quota.
- Looks stratified, but is not: the interviewer's choice of who to approach is not random, and interviewers approach people who look approachable.
Why stratifying reduces variability
- In a simple random sample, chance alone might hand you a sample that is 70% urban when the population is 55% urban. That sample would give a poor estimate.
- Stratifying removes that possibility. By fixing the urban/rural split to match the population, the estimate can no longer be wrong for that reason.
- This is worth saying precisely in an answer: stratification reduces sampling variability and improves the estimate provided the strata differ on the variable being measured. Stratifying by something irrelevant achieves nothing.
What sampling method can and cannot fix
| Problem | Fixed by a good sampling method? |
|---|---|
| Some groups over-represented by chance | Yes — stratifying handles it |
| Interviewer picking approachable people | Yes — random selection removes it |
| People not on the frame at all | No — fix the frame |
| Selected people refusing to answer | No — fix the follow-up |
| A leading or confusing question | No — fix the questionnaire |
- Nearly every report you evaluate will use a good method for the first two and be silent about the last three.
Weighting
- Reports of political polls often say results were weighted by age, gender, region and sometimes past vote.
- Weighting adjusts for a sample that came out unbalanced: if the sample has half as many 18–29 year-olds as the population does, each of their responses counts double.
- What weighting fixes: imbalance on the characteristics used for weighting.
- What it cannot fix: the possibility that the 18–29 year-olds who did respond are unlike those who did not. Doubling an unrepresentative voice makes it a louder unrepresentative voice.
Worked ExampleChoosing and defending a sampling method
A polytechnic with 6 000 students wants to estimate the average number of hours per week students spend in paid work. Its student roll records each student's programme (Trades 2 400, Business 1 800, Health 1 800) and whether they study full-time or part-time.
A staff member proposes surveying the first 300 students who enter the library one Tuesday morning.
(a) Name the proposed method and give two reasons it would produce a biased estimate. (b) Recommend a better method and justify why it improves the estimate.
(a) The proposed method
Step 1 — Name it. Taking whoever happens to arrive at one location at one time is a convenience sample. No random selection takes place at any point.
Step 2 — First reason, tied to the variable being measured. Students in paid work spend fewer hours on campus and are more likely to be in class-and-leave patterns or studying at home. A student working 30 hours a week is much less likely to be in the library on a Tuesday morning than a student working none.
Step 3 — Second reason, tied to the population structure. Library use is not even across programmes. Trades students spend most of their timetabled hours in workshops, so they are under-represented among library visitors — yet Trades is the largest group at 2 400 of 6 000 students, and apprentice-style study is strongly associated with paid work.
(b) A better method
Step 1 — Choose the method. Use a stratified random sample, stratified by programme and by full-time/part-time status, drawn from the student roll.
Step 2 — Set the allocation. Sample in proportion to the population. For a total sample of 300 by programme:
Within each programme, split again by full-time and part-time in the roll's proportions, then select at random within each cell.
Step 3 — Justify it against the two faults.
Step 4 — State what still needs handling.