Perfect competition in the short run
The four characteristics
You must be able to state these and use each one to explain a decision. The 2024 report is explicit that candidates who merely listed them scored lower than those who linked them.
- Very many small firms, each too small to influence the market price.
- Therefore each firm is a price taker with a horizontal MR = AR = D line.
- A homogeneous (identical) product — no branding, no quality difference.
- Therefore no firm can charge above the market price, because buyers would simply switch to an identical product elsewhere. And no firm needs to charge below it.
- No barriers to entry or exit.
- "No" barriers — not "low" and not "weak". The 2025 report says a moderate number of candidates lost marks for that synonym.
- Therefore supernormal profit attracts entry and losses cause exit, which is what drives the long run.
- Perfect information — every buyer and seller knows the market price and the available technology.
- Therefore no firm can get away with charging more, and no firm has a lasting cost advantage.
The short run
- The short run is the period in which at least one input is fixed, so the number of firms in the industry cannot change.
- With entry and exit blocked by time rather than by barriers, a perfectly competitive firm can make supernormal profit or a loss in the short run.
Short-run supernormal profit
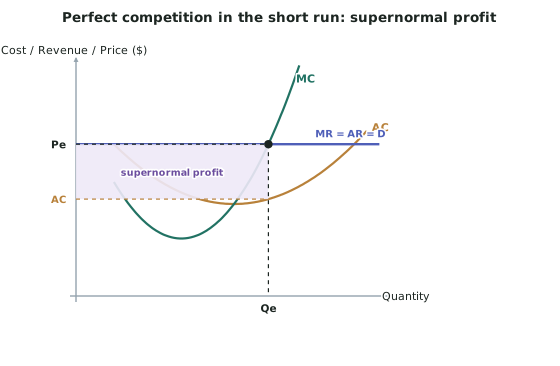
- The market price line sits above AC at the profit maximising output.
- Find the output: read down from where the price line crosses MC. That is where P (= MR) = MC.
- Find AC at that output: read the height of the AC curve at Qe.
- Supernormal profit is the rectangle between the price line and AC, out to Qe.
- Shade it and label it supernormal profit.
Short-run subnormal profit (a loss)
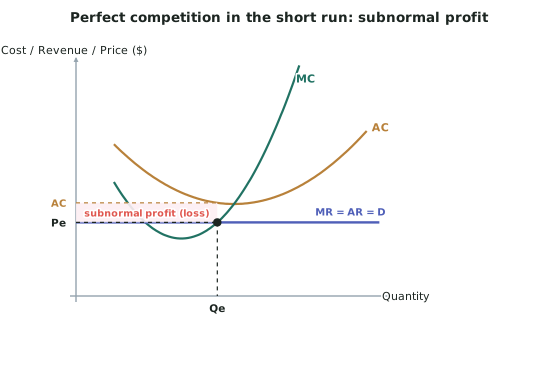
- The market price line sits below AC at the loss minimising output.
- The firm still produces where P = MC — this is now the loss minimising output, not a profit maximising one.
- Subnormal profit is the rectangle between AC and the price line, out to Qe.
- The firm keeps producing in the short run as long as the price covers its variable costs, because its fixed costs must be paid whether it produces or not.
The market and the firm together
- The market diagram sets the price through supply and demand.
- The firm diagram takes that price as a horizontal line.
- The two are always drawn side by side, and a change in the market shifts the firm's horizontal line up or down — it never changes the firm's cost curves.
Worked ExampleA perfectly competitive firm in the short run
An illustrative perfectly competitive market for a vegetable crop settles at a price of $6.00 per kilogram.
One grower's cost curves show that at the profit maximising output:
- Output is 9,000 kilograms
- Average cost is $4.50 per kilogram
Identify the profit maximising output, calculate the profit, and explain why the grower produces at that output.
Step 1 — Draw the revenue line
The grower is a price taker because there are very many growers selling an identical product, and this grower is far too small to affect the market price.
Its demand curve is therefore horizontal at $6.00, and because every kilogram sells at $6.00, MR = AR = D = $6.00.
Step 2 — Find the profit maximising output using marginal analysis
The grower expands output while MR > MC, because each extra kilogram brings in $6.00 and costs less than that, so producing it adds to profit. Stopping short would mean missing out on marginal profits.
It stops expanding where MR = MC, that is where the $6.00 price line crosses the MC curve.
Reading down from that intersection gives Qe = 9,000 kilograms.
Because MR is the price for a price taker, this is also the point where P = MC.
Step 3 — Identify the type of profit
At 9,000 kilograms, average cost is $4.50, and the price is $6.00.
P > AC, so the grower is making supernormal profit.
Step 4 — Calculate the profit
Profit per kilogram = P − AC = 4.50 = $1.50
Total supernormal profit = profit per unit × quantity = $1.50 × 9,000
Supernormal profit = $13,500
On the diagram this is the rectangle between the $6.00 price line and the AC curve, out to 9,000 kilograms. Shade it and label it.
Step 5 — Explain why it stops at 9,000
Below 9,000 kilograms, MC is below $6.00, so MR > MC and each extra kilogram adds to profit — the grower would be missing out on marginal profits by stopping earlier.
Above 9,000 kilograms, MC has risen above $6.00, so MR < MC and each extra kilogram would cost more than the $6.00 it earns — the grower would be making a marginal loss on it.
Profit is therefore maximised at exactly 9,000 kilograms, where MR = MC.
Step 6 — Why this cannot last
This is a short-run position. Because there are no barriers to entry, the $13,500 of supernormal profit will attract new growers into the market, and that is what drives the long-run outcome on the next page.