A rise in fixed costs versus a rise in variable costs
Why this comparison is examined so often
- It is the cleanest test in the whole standard of whether a candidate really understands marginal analysis, because the two cases have identical-looking causes and opposite effects on output.
- The 2025 paper built an entire question on it.
A rise in fixed costs
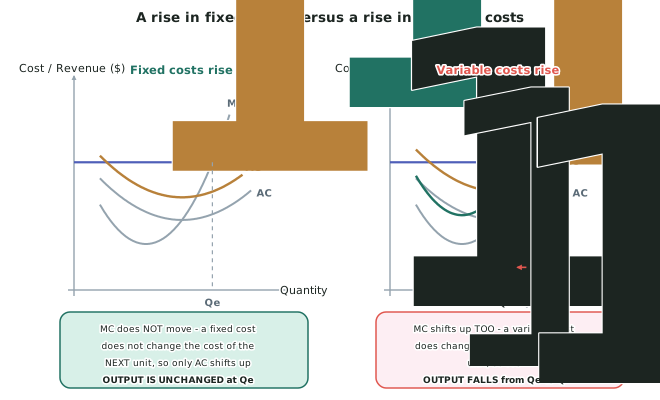
- A fixed cost is independent of output. It does not change the cost of producing one more unit.
- Therefore MC does not move at all.
- Only AC shifts up, to AC1.
Consequences
- The profit maximising output is where MR = MC. Neither MR (the market price line) nor MC has moved.
- Output is unchanged.
- Only profit falls, because AC is higher at that same output. The profit rectangle is shorter but the same width.
A rise in variable costs
- A variable cost does change with output, so it does change the cost of producing one more unit.
- Therefore both MC and AC shift up, to MC1 and AC1.
Consequences
- MC1 crosses the price line sooner — further to the left.
- Applying marginal analysis: at the original output Qe, MR < MC1, so the firm is now making a marginal loss on those units and will decrease output to Q1 where MR = MC1.
- Output falls, and profit falls too.
The comparison in one table
| Fixed costs rise | Variable costs rise | |
|---|---|---|
| MC curve | Does not move | Shifts up to MC1 |
| AC curve | Shifts up to AC1 | Shifts up to AC1 |
| Short-run output | Unchanged | Falls |
| Short-run price | Unchanged (price taker) | Unchanged (price taker) |
| Short-run profit | Falls | Falls |
| Reason | MC unmoved, so MR = MC is at the same Q | MC1 cuts MR sooner |
The long run in both cases
- In both cases AC has risen, so if the firm ends up making a loss, firms will exit because there are no barriers to exit.
- Exit decreases market supply, which raises the market price, until the survivors make normal profit again at the minimum of AC1.
- So the long-run price is higher in both cases, and there are fewer firms in the industry.
Worked ExampleComparing the two cost increases
An illustrative perfectly competitive farm sells at a market price of $8.00 per unit and currently produces 12,000 units, where P = MC. Its average cost at that output is $6.50.
Scenario A — council rates rise, adding $9,000 per year to costs. Scenario B — fertiliser prices rise, adding $0.75 to the cost of every unit produced.
For each scenario, explain what happens to the farm's output and profit in the short run.
Step 1 — The starting position
Profit per unit = 6.50 = $1.50 Supernormal profit = $1.50 × 12,000 = $18,000
Step 2 — Scenario A: classify the cost
Council rates are payable whether the farm produces anything or not. They are a fixed cost.
Step 3 — Scenario A: what moves on the diagram
Because fixed costs are independent of output, they do not affect the cost of producing one more unit.
MC does not move.
Only AC shifts up to AC1. At 12,000 units, average cost rises by:
$9,000 ÷ 12,000 = $0.75 per unit
So AC at that output becomes 0.75 = $7.25.
Step 4 — Scenario A: what happens to output
The profit maximising output is where MR = MC. The market price line has not moved, and MC has not moved, so the intersection is in exactly the same place.
Output is unchanged at 12,000 units.
Applying marginal analysis explicitly: at 12,000 units MR still equals MC, so there is no unit worth adding and none worth cutting.
Step 5 — Scenario A: what happens to profit
Profit per unit = 7.25 = $0.75 Supernormal profit = $0.75 × 12,000 = $9,000
Profit has fallen by exactly $9,000 — the whole of the rates increase. The rectangle is shorter but the same width.
Step 6 — Scenario B: classify the cost
Fertiliser is used in proportion to what is grown, so more output means more fertiliser. It is a variable cost.
Step 7 — Scenario B: what moves on the diagram
Because variable costs do change with output, they do change the cost of producing one more unit.
Both MC and AC shift up by $0.75, to MC1 and AC1.
Step 8 — Scenario B: what happens to output
At the original output of 12,000 units, MC has risen by $0.75 above the $8.00 price line.
MR < MC1 — the firm is now making a marginal loss on the last units.
To profit maximise it will decrease output to Q1, the point where MR = MC1. As output falls, MC1 falls back down its curve until it meets the $8.00 price line again.
Output falls below 12,000 units.
Step 9 — The comparison
| Scenario A (fixed) | Scenario B (variable) | |
|---|---|---|
| MC | Unchanged | Shifts up |
| AC | Shifts up | Shifts up |
| Output | Unchanged at 12,000 | Falls below 12,000 |
| Profit | Falls by $9,000 | Falls |
The whole difference comes from one fact: a fixed cost does not change the cost of the next unit, so it cannot change a decision made at the margin.