Cost and revenue curves
The costs a firm faces
- Fixed costs (FC) do not change with output. The firm pays them whether it produces one unit or a thousand.
- Rent, council rates, insurance, loan interest, the salary of a permanent manager.
- Because they are independent of output, fixed costs do not affect the cost of producing the next unit. Remember that sentence — it is the whole answer to the fixed-versus-variable question.
- Variable costs (VC) change with output. Produce more and they rise.
- Raw materials, fertiliser, electricity used in production, wages of casual staff, packaging.
- Total cost (TC) = FC + VC.
The two cost curves you draw
- Average cost (AC) is the cost per unit: AC = TC ÷ Q.
- It is U-shaped. It falls at first as fixed costs are spread over more units, then rises as diminishing returns push variable costs up.
- Marginal cost (MC) is the cost of producing one more unit: MC = ΔTC ÷ ΔQ.
- It falls at first, then rises. The rising part is caused by diminishing returns.
Why MC cuts AC at AC's minimum
This is the single most-marked detail in the whole standard, and the reason is pure arithmetic:
-
If the next unit costs less than the average so far, it pulls the average down. So while MC < AC, AC is falling.
-
If the next unit costs more than the average so far, it pulls the average up. So while MC > AC, AC is rising.
-
AC therefore stops falling and starts rising exactly where MC = AC — which is the minimum of AC.
-
The everyday version: your test average falls when you score below it and rises when you score above it, so your average is at its lowest right after the test that matched it.
The revenue curves
- Average revenue (AR) is revenue per unit: AR = TR ÷ Q. Since TR = P × Q, AR = price.
- So the AR curve is the firm's demand curve. Always. In both structures.
- Marginal revenue (MR) is the revenue from selling one more unit: MR = ΔTR ÷ ΔQ.
For a perfectly competitive firm
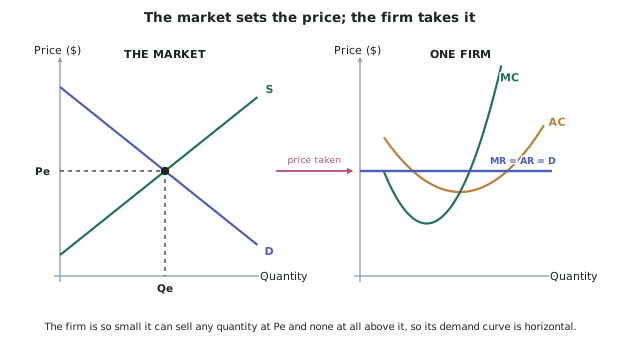
- The firm is a price taker, so it can sell any quantity at the market price and none above it.
- Its demand curve is horizontal: MR = AR = D = P.
- Selling one more unit adds exactly the price to revenue, so MR equals the price at every quantity.
For a monopoly
- The monopoly is the industry, so it faces the whole market demand curve, which slopes down.
- To sell one more unit it must lower the price on every unit, not just the last one.
- So MR is below AR at every quantity except the first, and MR falls twice as steeply as AR when AR is a straight line.
The types of profit
- Normal profit — the firm covers all its costs including the opportunity cost of the owner's capital. P = AC.
- Normal profit is included in AC. A firm making normal profit is doing well enough to stay in the industry.
- Supernormal profit — profit above normal. P > AC. Shown as the rectangle between the price line and AC, out to the profit maximising quantity.
- Subnormal profit (a loss) — P < AC. Shown as the rectangle between AC and the price line.
Worked ExampleBuilding the cost table
An illustrative firm has fixed costs of $60 per day. Its variable costs are shown below.
| Output (units) | Variable cost ($) |
|---|---|
| 1 | 40 |
| 2 | 70 |
| 3 | 90 |
| 4 | 120 |
| 5 | 170 |
Calculate total cost, average cost and marginal cost at each output, and identify where MC crosses AC.
Step 1 — Total cost
Add the fixed cost of $60 to each variable cost.
| Q | VC | TC = FC + VC |
|---|---|---|
| 1 | 40 | 100 |
| 2 | 70 | 130 |
| 3 | 90 | 150 |
| 4 | 120 | 180 |
| 5 | 170 | 230 |
Step 2 — Average cost
Divide total cost by output.
| Q | TC | AC = TC ÷ Q |
|---|---|---|
| 1 | 100 | $100.00 |
| 2 | 130 | $65.00 |
| 3 | 150 | $50.00 |
| 4 | 180 | $45.00 |
| 5 | 230 | $46.00 |
AC falls to a minimum of $45.00 at 4 units, then rises.
Step 3 — Marginal cost
Subtract each total cost from the one before it.
| Q | TC | MC = change in TC |
|---|---|---|
| 1 | 100 | — |
| 2 | 130 | $30 |
| 3 | 150 | $20 |
| 4 | 180 | $30 |
| 5 | 230 | $50 |
Step 4 — Find where MC crosses AC
Compare the two columns at each output.
- At 3 units: MC is $20, AC is $50. MC < AC, so AC is still falling.
- At 4 units: MC is $30, AC is $45. MC is still below AC, and AC has reached its minimum.
- At 5 units: MC is $50, AC is $46. MC > AC, so AC is now rising.
MC crosses AC between 4 and 5 units — exactly where AC is at its minimum of $45.
Step 5 — State the reason
While each extra unit costs less than the running average, it pulls the average down. Once an extra unit costs more than the running average, it pulls the average up. The turning point is where they are equal, so MC must cut AC at AC's minimum.