Exponential graphs
What an exponential graph is
- An exponential function has the variable in the power, e.g. or .
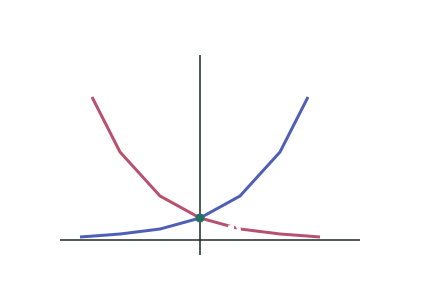
- The graph either grows ever more steeply or decays toward zero, depending on the base:
- ⇒ growth: the curve rises faster and faster to the right.
- (or a negative power, ) ⇒ decay: the curve falls toward the axis.
Key features of an exponential
- -intercept: put . Since , the graph crosses the -axis at (for that is ).
- Horizontal asymptote: the curve approaches but never reaches it — there is no -intercept for .
- Always positive: is never zero or negative, so the range is ; the domain is all real .
Modelling growth and decay
- Exponentials model anything that changes by a fixed percentage each step: populations, savings with compound interest, or a car losing value.
- Write these as :
- — the starting amount (when ).
- — the multiplier per step: for growth, for a loss.
A $24{,}000 car loses of its value each year, so its value after years is . Find its value when new and after 3 years, and describe the graph.
Step 1 — Value when new ()
This is the -intercept.
Step 2 — Value after 3 years
Step 3 — Describe the graph
Because , the curve decays: it starts at $24{,}000 and falls, flattening toward the asymptote — the car keeps losing value but never quite reaches $0.
Test yourself
Practice by grade
One question each at Achieved, Merit and Excellence. Have a go, then compare with the model answer.
State the -intercept of and whether the graph grows or decays.
A population of possums is modelled by , where is in years. Find the starting population and the population after 5 years, and state the yearly percentage increase.
Two savings options each start at $1000: Option A adds a flat $120 per year (); Option B grows at per year (). Determine which is worth more after 10 years, and explain what the graphs show about which option overtakes the other.