The paper, and what development means
What development means in this standard
- Development is the standard of living and the quality of life of people. That is the standard's own definition, and it has two halves that are not the same thing.
- Standard of living is what a person can buy and use — income, housing, food, clean water, electricity, transport. It is largely material and largely measurable.
- Quality of life is what a person's life is like — health, safety, education, freedom, time, dignity, being able to influence decisions that affect you. Much of it is not measurable in dollars.
- The two can move apart, and that gap is where the marks are. A worker whose income doubles while their working week rises to 70 hours has a higher standard of living and, quite possibly, a lower quality of life.
- Development is not the same word as economic growth. Growth is an increase in output. Development is what happens to people's lives, which depends on how that output is distributed and spent.
Development varies in space and changes over time
- The standard names four scales, and the exam can ask about any of them: individual, local, national and global.
- Spatial variation means development differs from place to place. It is not only a difference between countries: the gap between two suburbs of one city, or between a capital and a remote rural region, can be larger than the gap between two nations.
- Temporal change means development in one place changes over time. Almost every country now considered highly developed was not so a century ago, which matters because it makes development a process, not a category.
- Never describe the world as two groups. Developed and developing are two boxes stretched over a continuous range. The word geographers prefer is a continuum, and saying that a country sits at a stage along it is more accurate than saying which box it is in.
- The concepts this standard uses most are pattern (the spatial arrangement of development), process (how a difference is produced and maintained), change (how it moves over time) and interaction (how places affect each other's development). Name them and use them; the paper rewards the vocabulary.
What the paper looks like
- ONE question, no choice, all parts compulsory. That is true of every Geography external at both levels. Whether the parts are lettered (a), (b) or numbered (i), (ii) varies by year.
- The paper supplies example lists and then asks you to name one. Recent papers have printed indicators such as HDI, GDP, GNI, life expectancy, the Happiness Index and HALE, and factors such as rainfall, climate, location, laws, beliefs, trade, globalisation, colonisation and political systems. You choose from the list, or name your own.
- The instruction page says your case study evidence may be the same or different in each part. So a well-prepared pair of contrasting countries — one at an early stage, one at a late stage — can supply evidence for every part of the paper.
- The count is stated in the question and it is marked. ONE named indicator (2022, 2023), ONE factor, ONE strategy — but TWO strategies in 2025. Answering with one when the paper asked for two loses the second explanation entirely.
- Watch for the direction of the question. 2022 asked for the advantages of an indicator; 2023 asked for the disadvantages of one. Same aspect, opposite direction, and the standard's phrase indicators and their limitations makes both fair.
Preparing a case study that works for every part
- Prepare a pair, not a place. You need a contrast, because the standard is about differences. Choose two countries you have real information about at different stages.
- Build a table before the exam with a row for each of the four aspects and a column for each country. Fill every cell with something you could quote.
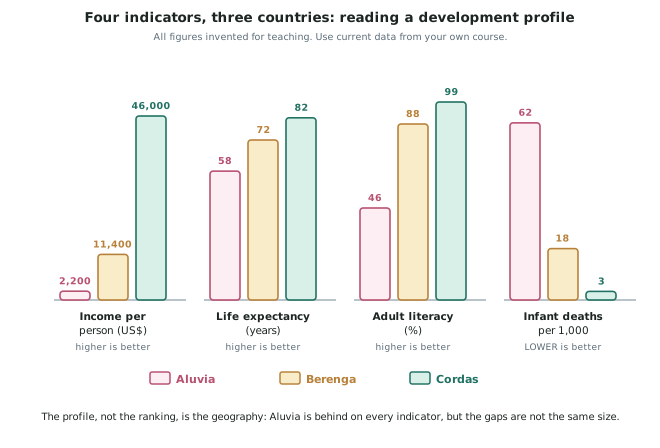
- Every cell needs a figure, a place and a date. Life expectancy is low is worth nothing; life expectancy of 58 years, against 82 in the comparison country is evidence.
- Learn a small number of figures properly rather than many badly. Six figures you can state exactly beat twenty you half-remember, because a wrong figure damages the answer more than a missing one.
- Attach a date to every figure. Development data changes yearly, and a figure with a year on it reads as knowledge; a figure without one reads as a guess.
Worked Example
Worked example
Two students begin an answer to: "Explain what is meant by differences in development, using case study evidence."
Attempt 1: Some countries are developed and some are undeveloped. Developed countries have more money and better lives. This is a big difference in the world today.
Attempt 2: Development means the standard of living and quality of life of people, and it differs between countries. Aluvia is less developed than Cordas because people there are poorer and do not live as long.
Which is closer to Achieved, and what would take it to Merit?
Answer:
Step 1 — check the definition.
Attempt 1 never defines development at all; it substitutes money and better lives. Attempt 2 gives the standard's definition, in the standard's own words, and both halves of it. Attempt 2 has the definition.
Step 2 — check the two-country requirement.
Attempt 1 names nobody. Attempt 2 names two places at different stages, which is what the standard's definition of case study evidence requires. Attempt 2 meets it; attempt 1 does not.
Step 3 — check the evidence.
Neither attempt contains a single figure. Poorer and do not live as long are comparisons without a size. Both are below Achieved on evidence.
Step 4 — write the Merit version, with the definition, the two places, and quantified evidence in both halves of the definition.
Development is the standard of living and quality of life of people, and it varies spatially and over time. The difference between Aluvia and Cordas shows both halves.
On standard of living, income per person in Aluvia is about US$2,200 a year against US$46,000 in Cordas — roughly a twentyfold gap, and the gap is in what people can buy: piped water, power, transport, a house that does not need rebuilding after each wet season.
On quality of life, the gap is smaller but affects more of daily life. Life expectancy is 58 years in Aluvia against 82 in Cordas, adult literacy 46 per cent against 99, and 62 infant deaths per 1,000 live births against 3. The literacy figure in particular is a quality-of-life measure rather than a standard-of-living one: it changes what work a person can choose and whether they can read the terms of their own tenancy.
(All figures invented for this page. In the exam these would be your own case study's current figures, each with its year.)