Measuring development: quantitative and qualitative indicators
What an indicator is, and the two kinds
- An indicator is a measurement standing in for something too large to measure directly. Nobody measures the development of a country; they measure a few things that development reliably changes.
- The word to keep is indicator, not measure. It indicates. That word contains the whole of the limitations aspect, which the next page is about.
- Quantitative indicators produce a number and can be ranked and mapped: income per person, life expectancy, literacy rate, infant mortality.
- Qualitative indicators describe what cannot be counted: whether people feel safe, whether a household expects the water to run, what a clinic waiting room is actually like. They usually come from interviews, surveys, photographs or written accounts.
- The standard requires both. Aspect 2 says quantitative and qualitative indicators, so an answer built only on numbers has covered half of it.
- The paper supplies examples and asks you to name one. Recent papers have printed HDI, GDP, GNI, life expectancy, the Happiness Index and HALE. You may name one of those or one of your own — but you must name it, not describe a general idea of measurement.
Single quantitative indicators, and what each one is good for
- GDP per person — the value of everything produced inside a country in a year, divided by the population. Available for almost every country every year.
- GNI per person — the same, but counting income earned by the country's residents wherever earned, and excluding income produced inside the country that leaves it.
- GNI is usually the better development indicator, because a profit generated in a country and paid to an owner overseas raises GDP without raising anyone's living standard there.
- Life expectancy at birth — the average years a newborn would live under current conditions; one figure summarising a lifetime of health, nutrition, water and safety.
- Infant mortality per 1,000 live births — the most responsive health figure, because it moves within a few years of clean water and vaccination arriving.
- Adult literacy rate and mean years of schooling — the two standard education figures.
- Purchasing power parity (PPP) is an adjustment, not an indicator: it converts incomes using what they actually buy locally rather than the exchange rate. Always say whether an income figure is PPP-adjusted, because the two versions of the same figure can differ by a factor of three.
Composite indicators
- A composite indicator combines several single indicators into one number, so that no single dimension decides the result.
- The Human Development Index (HDI) is the one the paper names most often. It combines three dimensions — a long and healthy life, knowledge, and a decent standard of living — into a score between 0 and 1, and countries are ranked on it.
- HDI's strength is its design. A country cannot rank highly on income alone, because health and education carry equal weight, so it corrects the most misleading feature of GDP per person.
- HALE (healthy life expectancy) counts only years lived in good health, so two countries with the same life expectancy separate if one spends a decade of it in poor health.
- The Happiness Index and similar wellbeing measures combine survey answers with quantitative data — the closest thing to a qualitative indicator with a number attached.
- Composite indicators trade detail for fairness. Two countries can share a score for opposite reasons, and the score cannot tell you which.
Qualitative indicators, and how to use them properly
- Qualitative evidence is not weaker evidence. It answers a different question. Numbers tell you how much; qualitative evidence tells you what it is like and why.
- The main sources are interviews and oral accounts, open questionnaires, photographs, field observation, and accounts written by people who live there.
- The strongest use is to explain an anomaly a number cannot. If two districts share a literacy rate but one has far lower attendance among girls, only an interview tells you whether the cause is distance, cost, safety or expectation.
- Qualitative evidence must still be specific to earn marks. People said life was hard is worthless. Households in the upper valley reported walking 90 minutes each way for water, and said the walk is why the older girls do not attend school is evidence, because it names the group, the quantity and the consequence.
- Name its weaknesses too: small samples, the influence of who was asked and by whom, and the difficulty of comparing one place with another.
Using two indicators together
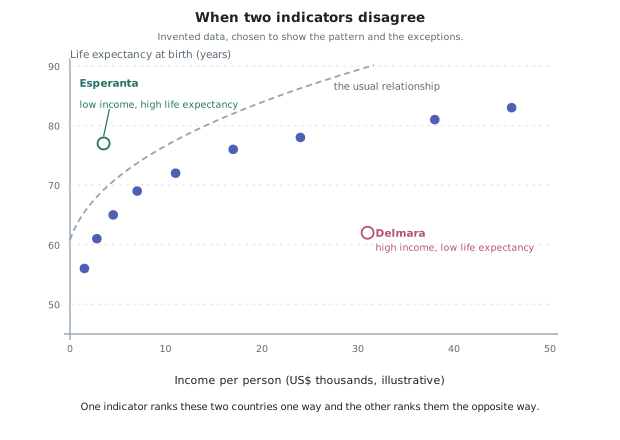
- Two indicators plotted against each other say more than either alone, because the information is in the points that do not fit.
- In the invented data above, most countries follow a curve: life expectancy rises steeply with income at first, then flattens. That shape is itself a finding — the first few thousand dollars per person buy water, food and vaccination and add many years; later thousands add few.
- Delmara has high income and low life expectancy, which usually means income is concentrated in a resource industry and few gains reach household services. Esperanta has low income and high life expectancy, which usually means primary health care and clean water were funded ahead of income growth.
- The two anomalies make one point: income and health are related but not the same thing, so which country you call more developed depends on which indicator you chose. That is the subject of the next page.
Worked Example
Worked example
With reference to ONE named indicator, explain the advantages of using it to measure development. Support your answer with case study evidence.
Answer:
Step 1 — name the indicator and define it.
The indicator is the Human Development Index (HDI). It is a composite indicator combining three dimensions — a long and healthy life, knowledge, and a decent standard of living — into a single score between 0 and 1.
Step 2 — state the first advantage, and evidence it.
It cannot be dominated by income alone. In the invented data used in this topic, Delmara has income of about US$31,000 per person, close to that of a late-stage country, but a life expectancy of 62 years. On income alone Delmara would rank near the top; because HDI gives health and education equal weight with income, Delmara's score falls well below countries with similar income and 20 more years of life expectancy.
Step 3 — state the second advantage, and evidence it.
It is comparable across countries and over time. Because it is a score between 0 and 1 built from the same three dimensions everywhere, Aluvia at 0.44 and Cordas at 0.93 can be compared directly without converting currencies, and Aluvia's own score can be tracked across decades to show the rate of change rather than only the position.
Step 4 — state the third advantage.
It matches the standard's definition of development. Development is standard of living and quality of life; HDI's dimensions cover both halves, where a single economic indicator covers one.
Step 5 — close by naming what the advantage costs.
The same design that makes HDI fair makes it coarse: Esperanta and a country with the opposite profile could reach a similar score for opposite reasons, and the score alone cannot say which. Naming this does not weaken the answer — the standard asks for indicators and their limitations, so a candidate who knows the cost of the advantage is answering both.
(All figures invented for this page.)