The characteristics of development
The three groups the standard names
- The standard describes the characteristics of development as based on economic, social and political factors and features. Those three words are the whole grouping, and they are a ready-made structure for an answer.
- Economic characteristics are about money and work: income, what people do for a living, what the country sells, and what it owes.
- Social characteristics are about people's lives: health, education, water, housing, population structure and equality between groups.
- Political characteristics are about power and administration: stability, the rule of law, corruption, and whether a government can actually deliver a service it has promised.
- The three interact, so a change in one shows up in the others within a generation. Tracing that path is what separates Merit from Achieved.
Economic characteristics
- Income per person is the headline figure, usually GNI or GDP per person, and it is where most answers start. Give it in the same currency for both countries or the comparison is meaningless.
- Employment structure is the more revealing figure: the share of workers in the primary sector (farming, fishing, mining), the secondary sector (manufacturing, construction) and the tertiary sector (services).
- A country early in development has most workers in the primary sector, because most effort goes into producing food, and the share moves to secondary then tertiary as development proceeds. In invented Aluvia the split is about 68 / 12 / 20; in Cordas about 3 / 19 / 78.
- What a country exports matters more than how much. A country selling unprocessed goods — ore, logs, raw cocoa — earns a small share of the final price and has no control over that price. A country selling processed goods captures more of the value and can set its own terms.
- Infrastructure is a characteristic in its own right: the share of households with electricity, piped water and all-weather road access.
- Debt belongs here too — repayments are money a government cannot spend on health or schooling this year.
Social characteristics
- Health is described with three figures: life expectancy at birth, infant mortality per 1,000 live births, and people per doctor. Infant mortality is the most sensitive, responding within a few years to clean water, vaccination and trained birth attendants.
- Education is described with two: adult literacy rate and mean years of schooling. Add the gap between boys' and girls' schooling if you have it — that gap is itself a development characteristic.
- Access to clean water and sanitation has the largest health effect for the least money, which is why it appears in almost every development programme.
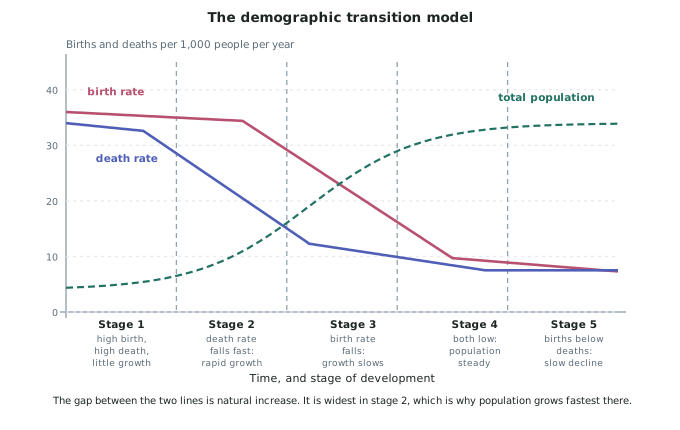
- Population structure changes with development in a predictable way, and the demographic transition model describes that change. It is a model — no country follows it exactly — but it converts a list of characteristics into a sequence.
- Urbanisation rises as employment moves out of the primary sector, so it is a social characteristic with an economic cause.
Reading the demographic transition model
- Stage 1 — high birth rate, high death rate, little growth. Disease and food insecurity keep deaths high; families are large partly because many children do not survive.
- Stage 2 — the death rate falls first and fast. Clean water, vaccination and better food cut deaths, especially infant deaths. Birth rates stay high, because family size responds to expectation rather than to this year's data. The gap between the two lines is at its widest, so population grows fastest here.
- Stage 3 — the birth rate falls. Children survive, so fewer are needed; schooling and employment for women raise the cost of a large family; contraception becomes available. Growth slows even though the population is still rising.
- Stage 4 — both rates are low and population is roughly steady.
- Stage 5 — births fall below deaths and the population slowly declines, with a rising share of older people.
- The one thing to take from the model: the lag between the death rate falling and the birth rate falling is what produces rapid population growth. Growth in stage 2 is not caused by people having more children; it is caused by more children surviving.
Political characteristics, and putting the three together
- Political stability matters because development requires time. A project that pays back over fifteen years does not get started where the next five are uncertain.
- Corruption reduces development directly: money allocated to a clinic that does not arrive buys nothing.
- The rule of law and secure land title decide whether an ordinary person can safely invest in their own house, farm or business.
- Capacity to deliver is the least obvious and the most important. A government may genuinely intend a vaccination programme and still lack the trained staff, cold storage and roads to carry it out — so a political characteristic is limited by economic and social ones.
- Describe a country by profile, not by rank. The useful sentence is not Aluvia is poor; it is Aluvia is at an early stage, with 68 per cent of workers in the primary sector, 46 per cent adult literacy, and a health system of one doctor per 9,000 people, but a stable government that has delivered a rising vaccination rate for a decade. That sentence has four markable characteristics in it and one contrast.
Worked Example
Worked example
Using the demographic transition model, explain why the population of the invented country Aluvia is growing rapidly, even though families are not having more children than they used to.
Answer:
Step 1 — establish where Aluvia sits, with evidence.
Aluvia's death rate has fallen from about 24 to 11 per 1,000 over thirty years, while its birth rate has fallen only from 42 to 36. A large fall in deaths with a small fall in births places Aluvia in stage 2 of the model.
Step 2 — explain why the death rate fell first.
Deaths fall because of things done to people, which can be delivered quickly and from outside: a piped water supply, a vaccination round, a trained birth attendant. Aluvia's infant deaths fell from 130 to 62 per 1,000 in the same period, and infant deaths are a large share of all deaths at this stage, so that one change moves the whole death rate.
Step 3 — explain why the birth rate has not followed yet.
Births fall because of decisions made by families, and those decisions respond to expectations built over a generation, not to this year's survival figures. Families that grew up expecting to lose children continue to plan for that. The economic reasons for a large family also persist: children work on the farm, and with no pension they are the only support in old age.
Step 4 — calculate what the gap produces.
Natural increase = birth rate − death rate
= 36 − 11 = 25 per 1,000 per year, or 2.5 per cent a year
At 2.5 per cent a year a population doubles in about 28 years.
Step 5 — answer the question as asked.
Families are not having more children — the birth rate fell, from 42 to 36. The population is growing rapidly because many more of the children born are surviving, and the birth rate has not yet adjusted to that. The growth is the lag between the two falls, not a rise in either.
(All figures invented for this page.)