The limitations of indicators
Why limitations are content, not criticism
- The standard names them. Aspect 2 is different ways development can be measured — quantitative and qualitative indicators and their limitations. An answer listing HDI and GNI without their weaknesses is incomplete against the Explanatory Notes.
- The paper has asked for them directly. In 2022 the question asked for the advantages of a named indicator; in 2023 it asked for the disadvantages of one. The same aspect, in either direction, and you cannot know in advance which you will get.
- Every indicator has the same three structural limitations, because of what an indicator is:
- it is a proxy — it stands in for something it is not
- it is an average — it summarises a group and is silent about the variation inside it
- it is a snapshot — it describes one moment and says nothing about direction
- Learn those three and you can produce limitations for any indicator the paper names, including one you have never met.
- A limitation is not a reason to reject the indicator. The useful sentence names the alternative: this indicator cannot show X, so read it alongside Y.
Limitation 1 — an average hides the distribution
- This is the most important limitation in the standard and the one most worth evidencing. An average income is the total divided by the population, and total and distribution are independent.
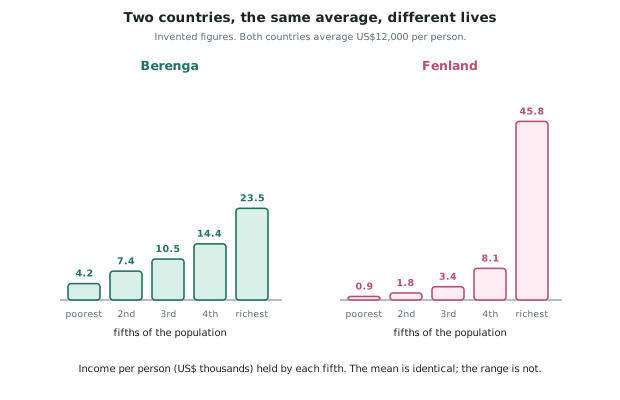
- Two countries can have the same mean income and completely different lives. In the diagram below, invented Berenga and Fenland both average US$12,000 per person, but split into fifths of the population they diverge completely.
- In Berenga the fifths hold roughly 4.2, 7.4, 10.5, 14.4 and 23.5 thousand dollars per person. In Fenland they hold 0.9, 1.8, 3.4, 8.1 and 45.8 thousand.
- The poorest fifth of Fenland lives on about a fifth of what the poorest fifth of Berenga lives on — and the national comparison finds the two countries identical.
- The fix is to name a distribution measure. Say that the mean should be read alongside the income held by the poorest fifth, the range, or the median, which is not moved by a small number of very large incomes.
Limitation 2 — what the indicator does not count
- Economic indicators count what passes through a market, so work that never reaches a market is invisible.
- Subsistence farming does not appear in GDP. A household that grows its own food, builds its own house and trades within the village may be counted as earning almost nothing, which overstates the difference between it and a wage-earning household.
- Unpaid work is not counted. Childcare, water collection, care of older relatives and household labour are real production and enter no economic indicator.
- The informal economy is largely missed — street trading, casual repair work, unregistered transport — and in some countries it is a large share of all work.
- Environmental cost is counted the wrong way. Selling a forest raises GDP in the year it is cut, and the loss reduces no indicator at all. An activity that lowers future development can raise the figure meant to measure development.
- Where the indicator is silent, quality of life is often loudest: safety, freedom of movement, and the ability to influence a decision.
Limitation 3 — the data itself
- Collecting good data is expensive, so the countries where development is lowest tend to have the weakest data. The measurement is least reliable exactly where it matters most.
- A census may be years out of date, and a figure derived from it inherits that age. Always quote the year with the figure.
- Definitions differ between countries. Literate, urban, employed and safe drinking water do not mean the same thing in every statistical system, so part of a difference can be a difference in definition.
- Exchange rates distort income comparisons. The purchasing power parity (PPP) version of a figure can be several times the unadjusted one, so say which you are using.
- A government has an interest in some of these numbers, and some are reported by the body being judged by them.
Limitation 4 — a snapshot has no direction, and qualitative indicators have limits too
- A single figure cannot say whether a place is improving. Two countries at an HDI of 0.61 are in different situations if one rose from 0.48 in a decade and the other fell from 0.70.
- Give every figure a date, and where you can, two dates. A rate of change is stronger evidence than a position, for the same amount of writing.
- Qualitative indicators have their own limitations, and naming them shows balance:
- small samples — twenty interviews cannot represent a nation
- who was asked, and by whom — people answer a government official differently from a neighbour
- hard to compare — two sets of interviews cannot be ranked the way two numbers can, and the researcher chooses what to record
- The conclusion the standard is looking for: use several indicators, of both kinds, each with a date, and treat disagreement between them as information rather than error.
Worked Example
Worked example
With reference to ONE named indicator, explain the disadvantages of using it to measure differences in development. Support your answer with case study evidence.
Answer:
Step 1 — name the indicator and define it.
The indicator is GDP per person: the value of everything produced inside a country in a year, divided by its population.
Step 2 — disadvantage 1, the average hides the distribution.
GDP per person is a mean, and a mean is silent about how the total is shared. Invented Berenga and Fenland both average US$12,000 per person. Split into fifths, Berenga's poorest fifth lives on about US$4,200 and Fenland's on about US$900.
Ratio between the two poorest fifths = 4,200 ÷ 900 ≈ 4.7 times
The indicator reports the two countries as identical while one poorest fifth lives on nearly five times what the other does.
Step 3 — disadvantage 2, it counts only what passes through a market.
In Aluvia, where 68 per cent of workers are in the primary sector, much production is subsistence — food grown and eaten, houses built by the household, water carried rather than bought. None of it enters GDP, so Aluvia's figure of US$2,200 understates what people actually consume, and overstates the gap to Cordas.
Step 4 — disadvantage 3, it counts the wrong sign on some activity.
If Aluvia sells a stand of timber, the sale raises GDP this year and the permanent loss of the forest lowers no indicator at all. An activity that reduces future development therefore improves the figure that is supposed to measure development.
Step 5 — disadvantage 4, it is a snapshot and it can be misdated.
A GDP figure describes one year and carries no direction. US$2,200 rising from US$1,400 a decade ago is a different country from US$2,200 falling from US$3,100, and the indicator alone cannot tell you which Aluvia is.
Step 6 — state the fix, which is what makes it an explanation rather than a complaint.
Read GDP per person alongside a distribution measure such as the share held by the poorest fifth, a social indicator such as infant mortality, and the same figure at two dates. Used that way its disadvantages are bounded; used alone it can rank two countries identically that are not alike in any respect that matters.
(All figures invented for this page.)