The role of prices and profits in allocating resources
The problem every economy has to solve
- Resources are scarce and wants are unlimited, so every economy must answer three questions:
- What to produce
- How to produce it
- For whom to produce it
- A market economy answers all three without anyone deciding centrally. Prices and profits do it.
Prices carry information
- A price is a signal that carries a great deal of information in a single number.
- A rising price tells producers that consumers want more of this good than is currently being made.
- A falling price tells producers that too much is being made relative to what consumers want.
- Nobody has to know why. A grower who sees the price of their crop double does not need to know whether it was a health story, an export deal or a shortage overseas — the price alone tells them to plant more.
Profits provide the incentive
- Information on its own does nothing. Profit is what makes producers act on it.
- Supernormal profit in an industry signals that resources are more valuable there than in their current use, and it rewards anyone who moves them.
- Losses signal that resources are less valuable in that industry than elsewhere, and they penalise anyone who stays.
The allocation mechanism
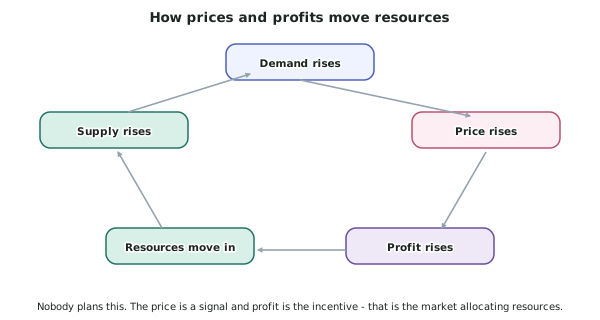
Trace it as a chain, and every answer on this concept should:
- Consumer demand rises for a good.
- With supply unchanged, a shortage appears at the old price, so the price rises.
- At the higher price, producers earn supernormal profit.
- That profit attracts resources — existing firms expand, and new firms enter, drawing in labour, capital and land.
- Supply increases, so the supply curve shifts right.
- The price falls back and supernormal profit is competed away.
- The market settles at a new equilibrium with a larger quantity: more resources are now allocated to this good, exactly as consumers wanted.
- Run it in reverse for a fall in demand: price falls, losses appear, resources leave the industry, supply decreases, price recovers, and fewer resources are allocated to the good.
How prices answer all three questions
- What to produce — goods consumers are willing to pay more for earn higher profits, so more resources go to them.
- How to produce it — producers minimise costs to maximise profit, so they choose the cheapest combination of inputs. Rising wages push firms towards machinery; falling technology costs push them further.
- For whom — output goes to those willing and able to pay the market price. This is where the mechanism is efficient but not necessarily fair, because ability to pay depends on income.
The limits of the mechanism
An honest answer must include these, and they are also the bridge to AS91402.
- It ignores costs and benefits that are not priced. Pollution is a real cost that no price captures, so markets over-produce goods that create it.
- It weights people by income. A wealthy household's demand for a luxury registers more strongly than a poor household's need for a necessity, because willingness to pay is limited by ability to pay.
- It does not supply public goods at all, because non-payers cannot be excluded.
- It responds slowly where supply is inelastic. The signal is sent immediately but the resources take years to move, which is why housing prices spike.
Worked ExampleTracing resource reallocation from data
An illustrative dataset records what happened in a regional horticultural market after a large export contract was signed.
| Year | Average price per tonne | Hectares planted | Number of growers |
|---|---|---|---|
| Year 1 | $2,400 | 850 | 34 |
| Year 2 | $4,100 | 880 | 35 |
| Year 3 | $3,900 | 1,180 | 44 |
| Year 4 | $3,100 | 1,640 | 58 |
| Year 5 | $2,700 | 1,880 | 63 |
Explain what this data shows about how prices and profits allocate resources.
Step 1 — Identify the initial shock
Between Year 1 and Year 2 the price rose from $2,400 to $4,100 — a rise of 71% — while hectares planted barely moved, from 850 to 880.
Something increased demand (the export contract), and because supply was almost perfectly inelastic in the short run — the crop already in the ground could not be increased — the entire adjustment fell on price.
Step 2 — Identify the profit signal
At $4,100 per tonne, growers' revenue per hectare rose sharply while their costs were unchanged, so they earned supernormal profit.
That profit is the signal and the incentive. It tells anyone watching that resources in this region are more valuable growing this crop than in whatever they were doing before, and it rewards those who move.
Step 3 — Trace the resource movement in the data
The response appears with a one-year lag, exactly as elasticity of supply predicts:
| Year | Hectares | Change | Growers | Change |
|---|---|---|---|---|
| 2 | 880 | +30 | 35 | +1 |
| 3 | 1,180 | +300 | 44 | +9 |
| 4 | 1,640 | +460 | 58 | +14 |
| 5 | 1,880 | +240 | 63 | +5 |
Both margins respond. Existing growers expand — hectares per grower rises from 25.9 in Year 1 to about 28 in Year 4 — and new growers enter, from 34 to 63, nearly doubling.
Land, capital and labour have been reallocated into this crop from whatever they were previously used for.
Step 4 — Trace the effect on price
As the additional hectares come into production, supply increases and the supply curve shifts right.
The price falls back: 3,900 → 2,700.
By Year 5 the price is only 12.5% above its Year 1 level, despite the much larger export demand — because the quantity supplied has more than doubled.
Step 5 — State what the mechanism achieved
Nobody planned this. No official decided that 1,030 additional hectares should be planted or that 29 new growers should enter.
- The price carried the information that more of this crop was wanted.
- The profit provided the incentive to act on it.
- Resources moved from lower-valued uses into this one.
- The price then fell back, competing the supernormal profit away and signalling that the reallocation was complete.
The market has answered what to produce — more of this crop — and how much — enough that the price has nearly returned to its starting level.
Step 6 — Note the limits shown by the same data
The response was slow. Nothing meaningful happened until Year 3. Because supply was inelastic in the short run, consumers and processors paid a 71% higher price for two full years before the resources arrived. The signal is instant; the reallocation is not.
The data does not show what was given up. The 1,030 hectares came from somewhere — other crops, grazing, or land not previously farmed. The mechanism moved them because this use was more profitable, which is not always the same as more valuable to society. If the displaced use had environmental benefits that no price captured, the market would have moved the resources anyway.
Overshoot is possible. Growers who planted in Year 4, responding to a $3,100 price, will harvest into a market where the price is $2,700 or lower. Because the production lag is long, some resources move on the strength of a signal that has already disappeared by the time they arrive.