Marginal utility and demand
Utility
- Utility is the satisfaction a consumer gets from consuming a good or service.
- It is subjective and cannot be measured in real units, so economists use an invented unit — utils — to compare.
- Total utility (TU) is the whole satisfaction from consuming a given quantity.
- Marginal utility (MU) is the extra satisfaction from consuming one more unit.
MU = change in TU ÷ change in quantity
The law of diminishing marginal utility
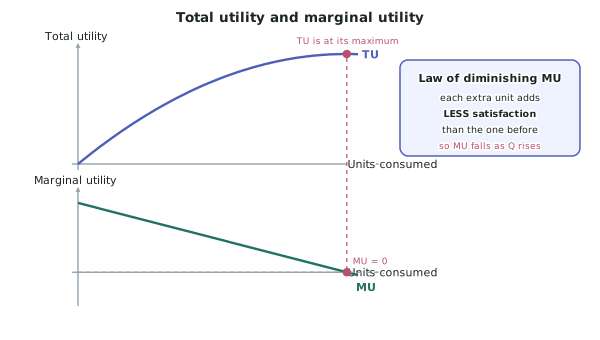
- As a consumer consumes more units of a good in a given period, the marginal utility of each extra unit falls.
- The first slice of pizza is wonderful. The fifth is fine. The eighth is unpleasant.
- The reason is satiation — the first units satisfy the most urgent want, and each later one satisfies a less urgent one.
Reading the two curves together
-
While MU is positive, each extra unit still adds something, so TU is rising.
-
TU is at its maximum exactly where MU = 0 — the last unit added nothing.
-
If MU turns negative, the extra unit actually reduces satisfaction, so TU falls.
-
The same arithmetic relationship you meet with MC and AC: the marginal tells you the direction of the total.
Why this explains the demand curve
This is the point of the concept, and it must be in every answer.
- A rational consumer will only buy an extra unit if the satisfaction it gives is at least as great as the satisfaction given up by spending the money elsewhere.
- So the maximum price a consumer will pay for a unit is a reflection of that unit's marginal utility.
- Because MU falls as more is consumed, the maximum price the consumer will pay also falls.
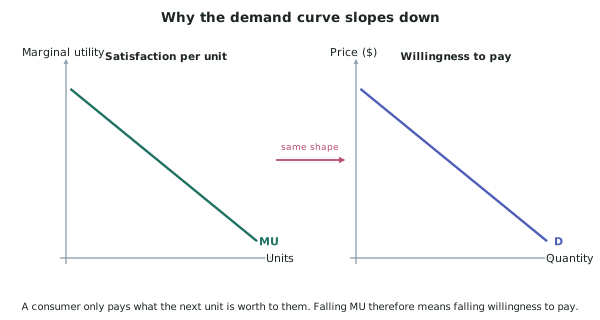
- The demand curve therefore slopes down, and its height at any quantity is the marginal utility of that unit expressed in dollars.
- This also explains consumer surplus: the gap between the height of the demand curve (what the unit is worth) and the price actually paid.
The equi-marginal principle
- A consumer with a fixed budget maximises total utility when the marginal utility per dollar is equal across everything they buy:
MU of A ÷ price of A = MU of B ÷ price of B
- If one good is giving more satisfaction per dollar, the consumer should buy more of it and less of the other, until the ratios equalise.
- This is why a fall in the price of A causes the consumer to buy more of A — the fall raises MU per dollar for A, so the balance shifts.
Collecting data for this concept
- A survey asking respondents to rate their satisfaction with each successive unit consumed in one sitting.
- A class simulation where students record how much they would pay for each successive unit.
- Present it as a table of TU and MU, then plot both, then plot the resulting demand schedule.
Worked ExampleBuilding a demand curve from utility data
An illustrative survey asked one consumer to rate their satisfaction from each successive cup of coffee in a single day, on a 0–10 scale.
| Cup | Satisfaction rating (utils) |
|---|---|
| 1st | 10 |
| 2nd | 8 |
| 3rd | 5 |
| 4th | 2 |
| 5th | 0 |
| 6th | −3 |
Process this data into total and marginal utility, identify where total utility is maximised, and explain what it shows about the demand curve.
Step 1 — Recognise what the raw data is
The satisfaction rating for each successive cup is the extra satisfaction from that cup, so this column is marginal utility (MU).
Step 2 — Build total utility by cumulative addition
Add each MU to the running total.
| Cup | MU | TU (running total) |
|---|---|---|
| 1 | 10 | 10 |
| 2 | 8 | 18 |
| 3 | 5 | 23 |
| 4 | 2 | 25 |
| 5 | 0 | 25 |
| 6 | −3 | 22 |
Step 3 — Identify the maximum of total utility
TU reaches its maximum of 25 utils at the 4th and 5th cups.
At the 5th cup, MU = 0 — that cup adds nothing at all, which is exactly why TU stops rising.
At the 6th cup, MU = −3 — the cup actively reduces satisfaction, so TU falls to 22.
Step 4 — State the law
Marginal utility falls with every successive cup: 10, 8, 5, 2, 0, −3.
This is the law of diminishing marginal utility: as a consumer consumes more units of a good in a given period, the marginal utility of each extra unit falls, because the first units satisfy the most urgent want and each later one satisfies a less urgent one.
Note carefully that TU is still rising from cup 1 to cup 4 even though MU is falling throughout. TU only falls when MU turns negative.
Step 5 — Convert to a demand schedule
A consumer will pay for a cup only up to what that cup is worth to them. If we value one util at $0.60, the maximum this consumer would pay for each cup is:
| Cup | MU (utils) | Maximum price (MU × $0.60) |
|---|---|---|
| 1 | 10 | $6.00 |
| 2 | 8 | $4.80 |
| 3 | 5 | $3.00 |
| 4 | 2 | $1.20 |
| 5 | 0 | $0.00 |
Step 6 — Explain the demand curve
Plot price on the vertical axis against quantity on the horizontal, using the maximum prices above.
The resulting curve slopes downwards, and it slopes downwards because marginal utility falls. At $6.00 this consumer buys 1 cup; at $3.00 they buy 3 cups; at $1.20 they buy 4 cups.
A lower price is needed to persuade the consumer to buy each extra cup, precisely because each extra cup is worth less to them than the one before.
Step 7 — What this implies for a producer
If a café wants to sell a fourth cup to this customer, it cannot do so at $6.00 — that cup is only worth $1.20 to them. This is why cafés offer loyalty cards and bulk deals: they are pricing later units closer to their falling marginal utility rather than at the price of the first.