The two-country model
What the model shows
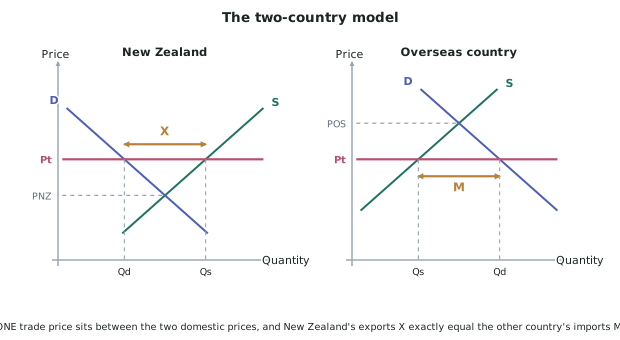
- The two-country model puts two markets side by side — New Zealand's market for a good, and the overseas country's market for the same good.
- It explains why trade happens and what the trade price will be.
Before trade
- Each country has its own domestic equilibrium price, where its own S and D cross.
- The country with the lower price is the efficient producer — it produces the good at a lower cost. It becomes the exporter.
- The country with the higher price becomes the importer.
After trade: the trade price
- Once the two markets are joined, there can only be one price, because buyers will not pay more than they must and sellers will not accept less than they can get.
- That single price is the trade price, Pt, and it sits between the two former domestic prices.
- Pt is drawn as one horizontal line across both diagrams, at the same height on both.
Reading exports and imports off the model
In the exporting country (the low-price one):
- Pt is above its old domestic price, so producers supply more (Qs) and consumers buy less (Qd).
- Exports = Qs − Qd.
In the importing country (the high-price one):
- Pt is below its old domestic price, so producers supply less (Qs) and consumers buy more (Qd).
- Imports = Qd − Qs.
The rule that fixes Pt:
- The trade price settles at exactly the level where the surplus in one country equals the shortfall in the other. Everything produced is bought.
- This is what you are checking when you draw it: the two gaps must be the same width.
Who gains and who loses in each country
| Exporting country (NZ) | Importing country | |
|---|---|---|
| Price | Rises to Pt | Falls to Pt |
| Producers | Gain — higher price, more sold | Lose — lower price, less sold |
| Consumers | Lose — pay more, buy less | Gain — pay less, buy more |
| Total quantity consumed | Falls | Rises |
- Trade always creates winners and losers inside each country. Naming both is what "compare and contrast" questions are asking for.
What happens when something changes
| Change | Effect |
|---|---|
| Demand rises in the importing country | Its shortfall grows → Pt rises, and exports from NZ increase |
| Supply falls in the exporting country (drought, herd reduction) | Its surplus shrinks → Pt rises, and exports fall |
| A new country joins the market as a supplier | More total supply → Pt falls |
| A free trade agreement removes a tariff | The importing country's price falls toward Pt → trade increases |
Worked ExampleDemand rises overseas
New Zealand and an overseas country both produce beef. New Zealand's domestic price is lower, so New Zealand exports beef at the trade price Pt.
Demand for beef then increases sharply in the overseas market.
(a) Show the change on the two-country model. (b) Explain the impact on the trade price and on New Zealand's exports. (c) Explain the impact on New Zealand beef consumers.
Step 1 — (a) Identify what moves and where
The change is in the overseas country's demand, so on the right-hand diagram the demand curve shifts right, from D to D1.
Nothing shifts in the New Zealand diagram. New Zealand's S and D curves are unchanged — no New Zealand producer or consumer has altered their behaviour yet.
Step 2 — Why the trade price must rise
At the old trade price Pt, the overseas country now wants to buy more than before, so its shortfall has grown.
But New Zealand's surplus at Pt has not grown — New Zealand's curves have not moved.
So at Pt, M is now greater than X. There is more demand for traded beef than there is beef being offered.
The excess demand bids the price up. The trade price rises from Pt to Pt1, and Pt1 is drawn at the same new height on both diagrams.
Step 3 — (b) What happens at the new price Pt1
In New Zealand:
- Producers move up the S curve → Qs rises to Qs1.
- Consumers move up the D curve → Qd falls to Qd1.
- The gap widens: exports rise from X to X1.
Overseas:
- Their producers supply more, their consumers buy less than they wanted at Pt.
- Their shortfall shrinks back down until it once again equals New Zealand's surplus: X1 = M1.
Export receipts rise on both counts: a higher price per unit (Pt1) and a larger quantity exported (X1).
Step 4 — (c) New Zealand beef consumers
New Zealand consumers now pay Pt1 instead of Pt — a higher price — because New Zealand producers can get Pt1 overseas and will not sell at home for less.
Reading up the New Zealand demand curve, quantity demanded falls from Qd to Qd1. New Zealand households eat less beef and pay more for it.
This is the point students miss: an export boom is good for New Zealand producers and bad for New Zealand consumers of the same good, because the domestic price is dragged up to the world trade price.