The price taker model
What the model shows
- New Zealand is a small economy. For most goods it produces a tiny share of world output, so nothing New Zealand does changes the world price.
- That makes New Zealand a price taker: it must accept the world price as given.
- The price taker model puts one New Zealand market — supply and demand for a single good — against a fixed world price.
How to read it
- Axes: price ($) on the vertical, quantity on the horizontal.
- S — New Zealand producers' supply, sloping up.
- D — New Zealand consumers' demand, sloping down.
- Pw — the world price, drawn as a horizontal line right across the diagram.
Why the world price is horizontal: New Zealand can sell as much as it likes, or buy as much as it likes, at that price without changing it. The line is flat because supply from (or demand by) the rest of the world is effectively unlimited at the world price, from New Zealand's point of view.
Case 1 — the world price is ABOVE the domestic equilibrium: New Zealand EXPORTS
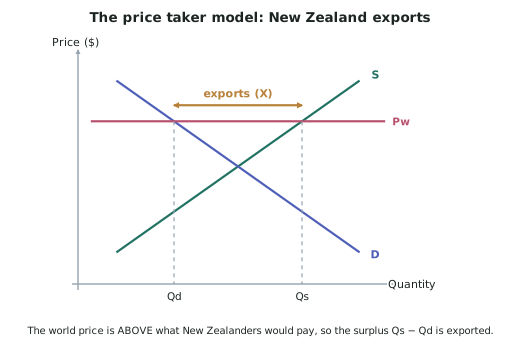
- At the high world price Pw:
- New Zealand producers want to supply a lot → read Qs off the S curve.
- New Zealand consumers want to buy less, because the price is high → read Qd off the D curve.
- Qs is greater than Qd. The surplus is exported.
- New Zealanders pay the world price for a New Zealand-produced good — producers would not sell domestically for less than they can get overseas.
Case 2 — the world price is BELOW the domestic equilibrium: New Zealand IMPORTS
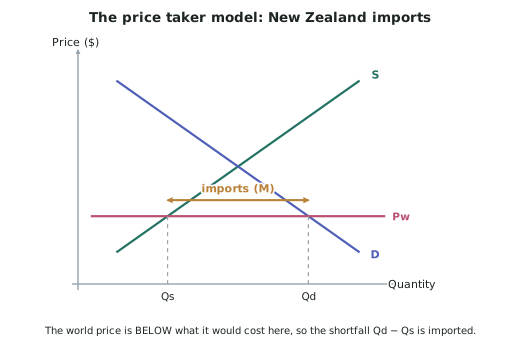
- At the low world price Pw:
- New Zealand consumers want a lot → Qd is large.
- New Zealand producers cannot profitably supply much at that low price → Qs is small.
- Qd is greater than Qs. The shortfall is imported.
What happens when something changes
| Change | What moves | Effect on exports |
|---|---|---|
| World price rises | Pw line moves up | Qs rises, Qd falls → exports increase |
| World price falls | Pw line moves down | Qs falls, Qd rises → exports decrease |
| NZ supply increases (better harvest, new technology) | S shifts right | Qs rises at the same Pw → exports increase |
| NZ supply decreases (drought, disease) | S shifts left | Qs falls → exports decrease |
| NZ demand increases | D shifts right | Qd rises → exports decrease |
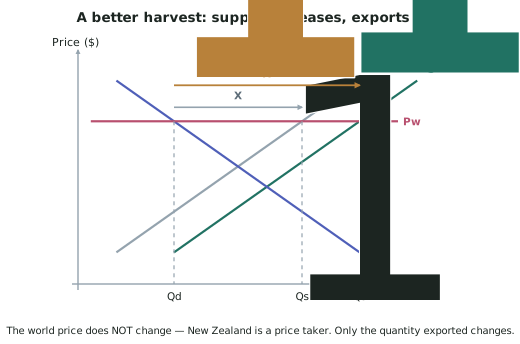
Critical point: when New Zealand's supply or demand shifts, the world price does not move. New Zealand is a price taker — the Pw line stays exactly where it is, and only Qs, Qd and the export gap change.
Export receipts
- Export receipts are the total money earned from exports:
- On the graph this is the rectangle whose height is Pw and whose width is the export gap.
- Watch what happens when the world price falls: the price per unit falls but the quantity exported also falls (Qs down, Qd up). Both effects push receipts down, so export receipts unambiguously fall.
- When supply increases at an unchanged world price, the price is the same and the quantity is larger, so export receipts unambiguously rise.
Worked ExampleA record harvest
New Zealand exports kiwifruit and is a price taker in the world kiwifruit market. After a poor season, growers achieve a record harvest the following year.
(a) Show on the price taker model what happens, and label the new level of exports as X1. (b) Explain the effect on the quantity of exports. (c) Explain the effect on export receipts.
Step 1 — (a) Decide what moves
A record harvest means New Zealand growers can supply more at every price. That is a shift of the supply curve to the right, from S to S1.
The world price Pw does not move. New Zealand is a price taker: even a record New Zealand harvest is too small a share of world supply to change the world price.
The demand curve D is unchanged — New Zealand consumers' willingness to buy has not altered.
Step 2 — Re-read the quantities at Pw
- Qd — where D meets Pw. Unchanged, because neither D nor Pw moved.
- Qs — where the supply curve meets Pw. This is now further right, at Qs1, because S1 lies to the right of S.
Step 3 — (b) The effect on exports
Because Qs has increased while Qd is unchanged, the gap between them is wider.
Exports increase, from X to X1.
In words: growers produce more, New Zealand consumers still buy the same amount at the unchanged world price, so the entire extra harvest is exported.
Step 4 — (c) The effect on export receipts
- The price per unit is unchanged at Pw, because New Zealand is a price taker.
- The quantity exported has risen from X to X1.
So export receipts rise. On the graph, the rectangle representing receipts keeps the same height and gains extra width.