Chemical shifts
What a chemical shift tells you
-
The horizontal axis of a 13C spectrum is the chemical shift, in parts per million (ppm), measured from a reference at 0 ppm.
-
Where a signal appears depends on the electron density around that carbon:
- Electron-withdrawing neighbours — oxygen, nitrogen, a halogen, a double bond — pull electron density away, deshielding the carbon and moving its signal downfield, to a higher ppm value.
- A carbon surrounded only by carbon and hydrogen is shielded and appears upfield, at a low ppm value.
-
So the shift identifies what kind of environment each carbon is in, while the number of signals tells you how many kinds there are.
The shift table
| Carbon environment | Shift / ppm |
|---|---|
| C–C (alkane) | 5–40 |
| C–Cl, C–Br (haloalkane) | 10–70 |
| C–N (amine, amide) | 25–60 |
| C–O (alcohol, ester, ether) | 50–90 |
| C=C (alkene) | 110–150 |
| C=O (ester, carboxylic acid, amide) | 160–185 |
| C=O (aldehyde, ketone) | 190–220 |
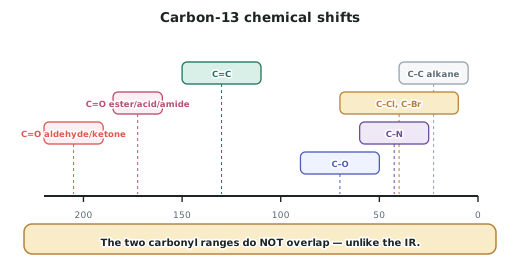
The most useful distinction in the table
-
The two carbonyl ranges do not overlap:
- 190–220 ppm → aldehyde or ketone
- 160–185 ppm → ester, carboxylic acid or amide
-
This is cleaner than the IR equivalent, where the C=O absorption ranges for these families overlap substantially.
-
Why they differ: in an ester, acid or amide, the oxygen or nitrogen attached to the carbonyl carbon donates electron density towards it, shielding it and moving the signal upfield. An aldehyde or ketone has no such neighbour, so its carbonyl carbon is the most deshielded carbon in ordinary organic chemistry.
Reading a spectrum
- Take each signal in turn and assign it to a range.
- Then check the assignment is consistent with the functional group from the IR and with the molecular formula.
For ethanoic acid, CH3COOH:
| Signal | Shift | Assignment |
|---|---|---|
| 1 | ~21 ppm | the CH3 carbon — bonded only to C and H |
| 2 | ~178 ppm | the COOH carbon — a carbonyl in the acid/ester/amide range |
- Two signals for two carbons, and the 178 ppm value confirms a carboxylic acid rather than a ketone.
Predicting a spectrum
-
Assessment tasks may ask you to work in reverse: given a structure, predict the number of signals and the approximate shift of each.
-
The method:
- Identify the distinct environments by symmetry.
- Assign each a range from the table, based on what is attached to it.
- State the number of signals and their approximate positions.
-
This is a good self-check on any structure you propose, and it is explicitly allowed as a task.
Worked ExampleAssigning every signal in a spectrum
A compound with molecular formula C3H6O2 gives 13C signals at 20 ppm, 51 ppm and 171 ppm. Its IR shows a strong absorption at 1740 cm−1 and nothing above 3000 cm−1 except C–H. Determine the structure and assign every signal.
Step 1 — Use the IR to fix the family
A strong absorption at 1740 cm−1 is a C=O, in the ester range of 1735–1750.
The absence of anything above 3000 cm−1 rules out O–H and N–H, so this is not a carboxylic acid, alcohol, amine or amide.
Combined with the formula C3H6O2, which has two oxygens, the compound is an ester.
Step 2 — Confirm with the carbonyl shift
The signal at 171 ppm falls in the 160–185 ppm range — the ester, acid or amide carbonyl range, not the 190–220 ppm aldehyde/ketone range.
This independently confirms the ester assignment made from the IR. Two different techniques agreeing on the same feature is exactly the integration the standard is looking for.
Step 3 — List the candidate structures
C3H6O2 as an ester has two possibilities:
- Methyl ethanoate, CH3COOCH3
- Ethyl methanoate, HCOOCH2CH3
Both have three carbons and three distinct environments, so the signal count alone does not separate them — both would give three signals.
Step 4 — Use the shifts to choose
Consider what each structure predicts.
Methyl ethanoate, CH3–CO–O–CH3:
- The CH3 attached to the carbonyl is bonded only to carbon and hydrogen → 5–40 ppm, so about 20 ppm.
- The CH3 attached to oxygen is deshielded by the oxygen → 50–90 ppm, so about 51 ppm.
- The carbonyl carbon → 160–185 ppm, about 171 ppm.
Predicted: ~20, ~51, ~171 ppm.
Ethyl methanoate, H–CO–O–CH2CH3:
- The terminal CH3 of the ethyl group → 5–40 ppm, about 14 ppm.
- The CH2 attached to oxygen → 50–90 ppm, about 60 ppm.
- The carbonyl carbon → about 161 ppm.
Predicted: ~14, ~60, ~161 ppm.
Step 5 — Match against the data
The observed signals are 20, 51 and 171 ppm, matching the methyl ethanoate prediction closely and the ethyl methanoate prediction poorly at all three positions.
Step 6 — Assign every signal
| Signal | Assignment | Reason |
|---|---|---|
| 20 ppm | the CH3 of the ethanoyl group | in the 5–40 alkane range; bonded only to C and H |
| 51 ppm | the OCH3 group | in the 50–90 C–O range; deshielded by the attached oxygen |
| 171 ppm | the carbonyl carbon | in the 160–185 ester/acid/amide range |
Answer: methyl ethanoate, CH3COOCH3. The ester is confirmed by the IR C=O at 1740 cm−1 with no O–H, and independently by the carbonyl shift at 171 ppm falling in the ester range rather than the 190–220 ppm aldehyde/ketone range. The three shifts match methyl ethanoate and exclude ethyl methanoate.