Populations, samples and inference
What statistical inference is
- Inference means using incomplete information — a sample — to make a reasoned estimate about something larger you cannot see in full.
- In statistics, you measure a sample and use it to infer (estimate) a feature of the whole population.
- The answer is never certain. A good inference says what is likely, and is honest that a different sample would give slightly different numbers.
Population and sample
- The population is the entire group you want to know about — every kiwifruit on the orchard, every Year 11 student in New Zealand.
- A sample is the smaller group you actually measure, chosen from the population.
- For an inference to be trustworthy the sample must be a random sample — every member of the population has an equal chance of being picked, so the sample is representative and not biased.
Parameter and statistic
- A parameter is a number that describes the population (e.g. the population median weight). It is fixed but unknown.
- A statistic is the matching number worked out from the sample (e.g. the sample median). You can calculate it, and you use it to estimate the parameter.
| Describes the… | Name | Example | Known? |
|---|---|---|---|
| Population | Parameter | population median | No — you estimate it |
| Sample | Statistic | sample median | Yes — you calculate it |
Why we take a sample
- Measuring the whole population is usually impossible: too many members, too expensive, too slow, or the test destroys the item (you cannot eat-test every kiwifruit).
- A well-chosen sample gives a good estimate for far less time and cost.
Sampling variability — the key idea
- Take a different random sample and you get a different sample median. This natural difference between samples is sampling variability.
- Because of it, you must never treat one sample median as the exact population value.
- Larger samples vary less, so they pin the population value down more tightly. This is why sample size matters.
The enquiry cycle (PPDAC)
- A statistical investigation runs through five stages, often drawn as a loop:
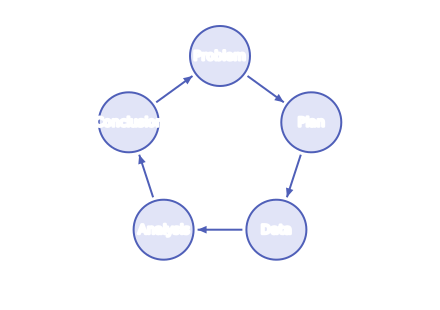
- Problem — write a clear comparison question about the populations.
- Plan — decide how to sample and what to measure.
- Data — collect, clean and organise the measurements.
- Analysis — draw the graphs and build the confidence intervals.
- Conclusion — answer the question in context and reflect on it.
Writing a good comparison (investigative) question
- It must be about the populations, not the samples — you already know the samples.
- It must name a variable to measure and the two groups to compare.
- It should ask about a general tendency (use the median), e.g.:
"I wonder whether the median weight of kiwifruit from Orchard A is different from the median weight of kiwifruit from Orchard B?"
A supermarket buyer wants to know whether apples from Hawke's Bay are heavier than apples from Nelson. She weighs a random sample of 40 apples from each region. Identify the population, sample, parameter and statistic, and write a suitable comparison question.
Step 1 — Population and sample
- Population: all apples from Hawke's Bay (and all apples from Nelson).
- Sample: the 40 apples she actually weighed from each region.
Step 2 — Parameter and statistic
- Parameter: the population median weight for each region — fixed but unknown.
- Statistic: the sample median weight of the 40 apples — calculated, and used to estimate the parameter.
Step 3 — Comparison question
From sample to inference
- You will describe and compare the two sample distributions, build an informal confidence interval for each population median, and use whether those intervals overlap to decide what you can honestly say about the populations.
Test yourself
Practice by grade
One question each at Achieved, Merit and Excellence. Have a go, then compare with the model answer.
A council measures the daily water use of a random sample of 50 households in Wellington. State the population and the sample.
For the water-use study, explain the difference between a parameter and a statistic, using the median as your example.
A student says, “My sample median is 165 L, so the median for all Wellington households is exactly 165 L.” Explain why this is wrong, using the idea of sampling variability.