Describing and comparing two distributions
Comparing two distributions
- Draw both box plots on the same scale, one above the other, so you can compare them directly.
- Work through four things every time: centre, spread, shape, and overlap — plus any unusual features.
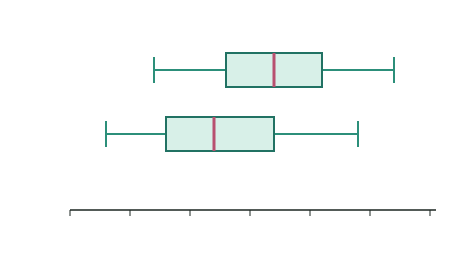
Context: press-ups in one minute for a random sample from a Year 13 PE class (Sample A) and a Year 11 PE class (Sample B).
Compare the centre (median)
- Read each median and state which is higher and by how much, in context.
- Example: "The median for Sample A is 34 press-ups, which is 10 more than Sample B's median of 24."
Compare the spread (IQR)
- Compare the box widths (the IQRs). A wider box means the middle 50% is more spread out — less consistent.
- Example: "Sample A's middle 50% is a little more spread out than Sample B's, so the Year 13 results are slightly less consistent."
Compare the shape
- Describe skew for each group from the median's position in its box and the whisker lengths.
- Example: "Sample B is roughly symmetric; Sample A is skewed toward the higher values."
Overlap — do the boxes separate?
- Look at whether the boxes overlap or sit clearly apart.
- If the boxes overlap a lot, plenty of Sample B members score higher than plenty of Sample A members, even though A's median is higher — so the groups are not cleanly separated.
- Example: "The boxes overlap between about 26 and 42, so many Year 11 students did more press-ups than many Year 13 students."
Unusual features
- Point out outliers, gaps, or a very long whisker — anything that a single summary number would hide.
- These can make the median misleading, so they are worth a sentence.
Writing "I notice ..." statements in context
- Turn each comparison into a full sentence that names the variable, the groups, and a number:
- "I notice the median number of press-ups for Sample A (34) is higher than for Sample B (24)."
- "I notice Sample A's results are more spread out (wider box)."
- "I notice the boxes overlap, so the groups are not clearly separated."
Random samples of reaction times (ms) give: Group A median 210, , ; Group B median 250, , . Both boxes are drawn on the same scale. Compare the distributions.
Step 1 — Centre
Group A's median (210 ms) is 40 ms lower than Group B's (250 ms), so Group A tends to react faster.
Step 2 — Spread
Group B's middle 50% is a little more spread out (IQR 60 vs 50), so Group B is less consistent.
Step 3 — Overlap
Group A's box (190–240) and Group B's box (230–290) overlap between about 230 and 240. So some Group B reactions are as fast as some Group A reactions — the groups are not completely separated.
Step 4 — In context
Test yourself
Practice by grade
One question each at Achieved, Merit and Excellence. Have a go, then compare with the model answer.
Sample X has median 52; Sample Y has median 45. Both are drawn on the same scale. Write one 'I notice' statement comparing the centres in context (the variable is exam mark, %).
Sample X: , . Sample Y: , . Compare the spread and comment on what it means.
Sample X (median 52, box 44–58) and Sample Y (median 45, box 40–50) are on the same scale. Discuss the overlap and explain why the higher median alone does not prove Sample X's population scores higher.