The annotated map or diagram
Why this page exists
- The answer booklet contains a titled MAP / DIAGRAM page and you are required to fill it. This has been true in every paper checked from 2022 to 2025, and the 2026 specification confirms the question has a written and a visual component.
- In 2025 the drawing became part (a) of the question in its own right, with the written analysis as part (b) — so it carried its own marks and its own instruction.
- In that year part (b) had to be about a second, different feature from the one drawn in part (a). That is a countable trap: two features, not one described twice.
- The drawing is marked on its annotations, not on its artistic quality. A rough sketch with six process annotations beats a beautiful map with six place names.
- Annotations must be in pen; colour comes from coloured pencils. Both are named in the assessment specification, along with a ruler and a calculator.
The difference between a label and an annotation
- A label names a thing. Mt Rakaunui. The river. Cliff. Labels are necessary and worth very little on their own.
- An annotation explains something. Lahars sweep this channel about every 30 years, depositing up to 18 m of gravel where the gradient falls to 3°.
- Every annotation should contain a process, a mechanism or rate, and a place. If one of the three is missing, add it — it costs six words.
- Aim for five to seven annotations. Fewer and the drawing is a map; more and you are writing your essay twice.
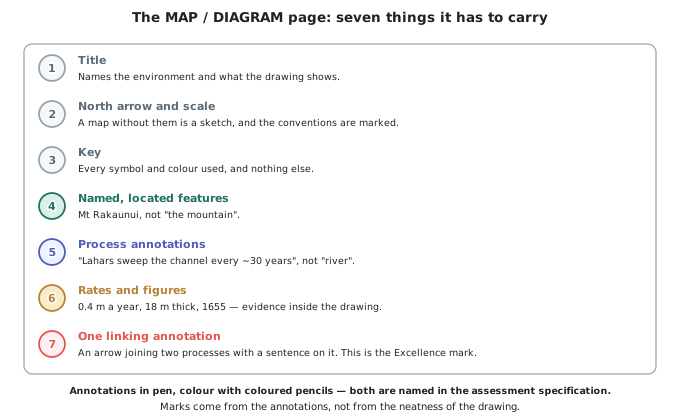
- The annotation that earns the most is the one on an arrow between two processes, because that is interaction shown visually — the thing the standard is about.
Choosing what to draw
- You have two sensible choices: a sketch map or a cross-section. Both are accepted; pick the one that shows your processes best.
- Choose a sketch map when your processes operate in different places — a volcano, a valley and a coast. A map shows spatial variation directly.
- Choose a cross-section or a process diagram when your answer is about one feature being formed in stages, or about what is happening beneath the surface.
- You can draw both if you have time, but one done properly beats two done thinly.
- If the question asks about a specific feature, draw that feature, not the whole environment. In 2025 part (a) named a feature and required the diagram to explain how interacting processes shaped it.
The conventions, which are marked directly
- Title. Name the environment and say what the drawing shows. The Mangatoi environment: interacting processes shaping the ring plain.
- North arrow on any map. It takes three seconds and its absence is noticed.
- Scale, as a scale bar with a stated distance. An approximate scale is fine and far better than none.
- Key, listing every symbol and colour you used and nothing you did not.
- Named, located features. Mt Rakaunui, 2,180 m, not the mountain.
- Draw big. Use the whole page. Small drawings leave no room for the annotations that carry the marks.
A working order for the ten minutes it should take
- Sketch the outline first — coastline, range, cone, main channel. Two minutes, in pencil, no detail.
- Add and name the features you are going to talk about. One minute.
- Add the conventions — title, north arrow, scale bar, key box. One minute, and do it now so it cannot be forgotten.
- Write the annotations in pen, one per process, each with a rate. Four minutes. This is the part being marked.
- Add one linking arrow with a sentence on it — this sediment feeds this beach, which protects this cliff. One minute, and it is the highest-value minute on the page.
- Colour last, with coloured pencils, only if time remains. It helps the key and it earns nothing on its own.
Worked Example
Worked example
On the MAP / DIAGRAM page, construct an annotated map or diagram showing how interacting natural processes have shaped ONE feature of a New Zealand geographic environment you have studied.
The feature chosen is the Mangatoi ring plain. Here is how the ten minutes are spent, and what goes on the page at each step.
Answer:
Step 1 — decide map or section. The ring plain is about 28 km across and its story is about material arriving from one point and stopping at a gradient. Both a map and a section would work. A cross-section is chosen, because the key evidence is the 18 m of deposit and its thinning outward, which a map cannot show.
Step 2 — draw the outline. A single profile line from the summit of Mt Rakaunui (2,180 m) on the left, down the cone, across the plain, to the coast at Ōtaraki on the right. Vertical scale exaggerated, and a note saying so.
Step 3 — add and name the features. Summit, upper cone, ring plain, the Mangatoi River channel crossing it, the outer edge of the plain, the coast.
Step 4 — add the conventions. Title: The Mangatoi ring plain — interacting processes in cross-section. Horizontal scale bar reading 0–20 km. A key for the two shadings used. No north arrow is needed on a section, but the ends are labelled NE and SW.
Step 5 — write the annotations in pen. Five, each with a process and a rate:
- On the upper cone: 28° slope of bare tephra; 4,800 mm rain a year runs off in minutes, generating lahars about every 30 years.
- At the break of slope: gradient falls to 3°; flow spreads, loses energy and deposits — this is what fixes the outer edge of the plain, 28 km from the cone.
- On the plain surface: lahar deposits up to 18 m thick, thinning outward; 30 cm tephra layer from the 1655 eruption near the top.
- In the channel: the river reworks these deposits, incising at about 1.4 mm a year and leaving five terraces.
- At the coast: reworked volcanic sediment reaches Ōtaraki and builds the beach.
Step 6 — add the linking arrow. An arrow drawn from the cone annotation to the coast annotation, with a sentence written along it:
The same material is supplied here, stored on the plain for decades, and delivered here — so the beach width at the coast records eruptions that happened 78 km inland.