Inequitable distribution and merit goods
Why inequity counts as a market failure
- A market allocates goods to those willing and able to pay. Ability to pay depends on income, so the market's outcome reflects the existing distribution of income and wealth.
- If society judges that distribution unfair, the market has failed on equity — even if it is perfectly efficient.
- The standard lists inequitable income and/or wealth distribution as a market failure in its own right.
Income is a flow — what a household receives over a period, from wages, profit, interest, rent and benefits. Wealth is a stock — what a household owns at a point in time, such as housing, savings and shares, minus what it owes.
- Wealth is more unequally distributed than income in most countries, because wealth accumulates and is inherited.
The Lorenz curve
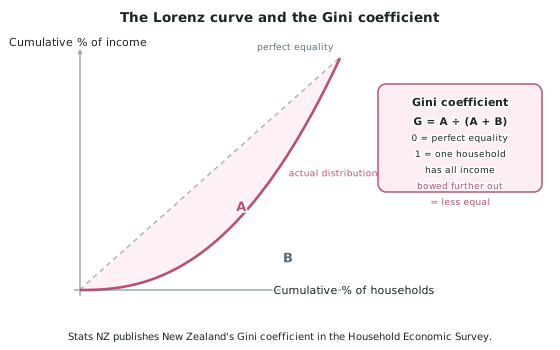
The NZQA clarification names this as the appropriate model for income and wealth inequity.
How to read it
- Horizontal axis: the cumulative percentage of households, ranked from poorest to richest.
- Vertical axis: the cumulative percentage of total income those households receive.
- The 45-degree line is perfect equality — the poorest 20% of households would receive 20% of income, the poorest 50% would receive 50%, and so on.
- The actual distribution is a curve bowed below that line: the poorest 20% receive far less than 20% of income.
- The further the curve bows away from the line, the more unequal the distribution.
The Gini coefficient
Gini = A ÷ (A + B)
-
A is the area between the 45-degree line and the Lorenz curve.
-
B is the area below the Lorenz curve.
-
Gini = 0 is perfect equality; Gini = 1 is one household holding all the income.
-
Stats NZ publishes New Zealand's Gini coefficient from the Household Economic Survey.
-
An intervention that reduces inequality pulls the Lorenz curve towards the 45-degree line, shrinking area A and lowering the Gini.
Interventions for inequitable distribution
The standard names four:
- Progressive taxes — a higher rate on higher incomes, so the tax takes a larger share from those best able to pay. New Zealand's income tax is progressive.
- Progressive: rate rises with income. Proportional: same rate at all incomes. Regressive: takes a larger share of a low income than a high one — GST is regressive, because low-income households spend a larger share of their income.
- Welfare benefits — transfers to those with low or no income: Jobseeker Support, Supported Living Payment, Working for Families, NZ Superannuation.
- Collective provision — services funded from taxation and provided to all regardless of income, such as public health care and state education.
- Minimum wage — a legal floor on the hourly rate, set by MBIE.
Merit goods
- A merit good is a good or service that is under-consumed relative to what society judges desirable, for two reasons together:
- It has a positive consumption externality — consuming it benefits others too.
- Consumers undervalue the private benefit to themselves, often because the benefit is long-term, uncertain or poorly understood.
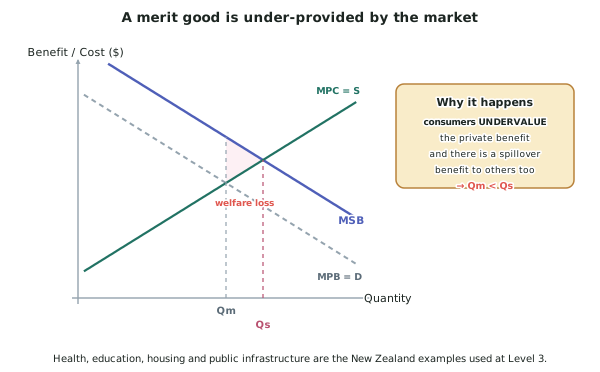
- On the model, MSB lies above MPB and Qm < Qs, just as with a positive consumption externality — but the gap has two components rather than one.
Examples: health care, education, home insulation, dental care, preventive screening.
- The clarification adds that merit goods include inequitable access to housing, property, national walking tracks and public infrastructure — so access questions are firmly in scope.
Interventions the standard names: collective provision, government grants, targeted services.
Why merit goods link equity to efficiency
- The efficiency case: the market under-provides, so there is a welfare loss between Qm and Qs.
- The equity case: the households that under-consume most are the ones with the least ability to pay — and often those with the greatest need.
- A merit good is where the two arguments point the same way, which is why intervention in health, education and housing is so widely accepted.
Worked ExampleAssessing an intervention with the Lorenz curve
An illustrative economy has the following income distribution before and after a package of progressive taxes and welfare benefits.
| Household group (poorest first) | Share of total income BEFORE | Share AFTER |
|---|---|---|
| Poorest 20% | 4% | 8% |
| Second 20% | 9% | 13% |
| Middle 20% | 15% | 17% |
| Fourth 20% | 24% | 24% |
| Richest 20% | 48% | 38% |
Construct the cumulative shares, describe what happens to the Lorenz curve, and assess the intervention on equity and efficiency.
Step 1 — Build the cumulative shares
The Lorenz curve plots cumulative percentages, so add each group's share to the running total.
| Cumulative % of households | Cumulative % of income BEFORE | Cumulative % of income AFTER | Perfect equality |
|---|---|---|---|
| 20% | 4% | 8% | 20% |
| 40% | 13% | 21% | 40% |
| 60% | 28% | 38% | 60% |
| 80% | 52% | 62% | 80% |
| 100% | 100% | 100% | 100% |
Step 2 — Describe the curves
Plot cumulative % of households on the horizontal axis and cumulative % of income on the vertical.
The 45-degree line joins (0,0) to (100,100) and represents perfect equality.
Before the intervention, the curve passes through (20, 4), (40, 13), (60, 28) and (80, 52) — a long way below the line. The poorest 40% of households receive only 13% of total income.
After the intervention, the curve passes through (20, 8), (40, 21), (60, 38) and (80, 62) — still below the line, but closer to it at every point. The poorest 40% now receive 21%.
Step 3 — State the movement in model language
The Lorenz curve has shifted towards the 45-degree line at every point.
Area A — the area between the line and the curve — has shrunk.
Because Gini = A ÷ (A + B), a smaller A means a lower Gini coefficient. The distribution of income is more equal after the intervention than before.
Step 4 — Quantify the change
The share going to the richest 20% has fallen from 48% to 38% — a fall of 10 percentage points.
The share going to the poorest 20% has doubled, from 4% to 8%.
The ratio of the richest fifth's share to the poorest fifth's has fallen from 12:1 to 4.75:1.
Step 5 — Assess on equity
The intervention clearly improves equity.
- The progressive tax takes a larger share of income from those best able to pay, which reduces the top group's share.
- Welfare benefits raise the incomes of those with least, which is why the bottom group's share doubles.
- The Lorenz curve moves towards the line of perfect equality at every point and the Gini falls.
Note that the fourth 20% is unchanged at 24%. This group is neither a major net contributor nor a major net recipient — it sits around the point where tax paid and transfers received balance.
Step 6 — Assess on efficiency
This is where the answer must be balanced rather than enthusiastic.
Arguments that efficiency is reduced:
- A progressive tax raises the marginal tax rate on additional income, which reduces the reward for extra work, extra hours or additional training. At high rates this can reduce labour supply and effort.
- Welfare benefits that abate as earned income rises create an effective marginal tax rate on the recipient that can be very high, so some recipients face little financial gain from taking additional work.
- Administering both systems consumes real resources.
Arguments that efficiency is improved:
- Households on very low incomes are credit-constrained and cannot fund education, training or health care that would raise their future productivity. Transfers relieve that constraint, which raises long-run productive capacity.
- Better-fed, better-housed and healthier households are more productive, and children in them achieve more in education — so the transfer is partly an investment.
- Extreme inequality carries social costs — crime, poor health outcomes, reduced social cohesion — that consume resources.
Step 7 — The overall assessment
On equity the intervention succeeds unambiguously: the Lorenz curve moves towards the line and the Gini falls, with the poorest fifth's share doubling.
On efficiency the effect is genuinely ambiguous, and depends on the design rather than on the principle. High abatement rates and steep marginal rates create disincentives; transfers that relieve credit constraints and fund human capital raise capacity.
The judgement: the intervention is justified on equity grounds, and the efficiency cost is a price rather than a verdict. The government's task is to minimise that price through design — lower abatement rates, in-work supplements, and directing collective provision towards services that raise productive capacity — rather than to abandon the objective.