The four externality cases
The two questions that identify any externality
Every externality question is answered by asking two things in order:
- Does the effect come from PRODUCING or from CONSUMING?
- Producing → the externality moves the cost curve. SMC differs from MPC.
- Consuming → the externality moves the benefit curve. MSB differs from MPB.
- Is the effect on third parties a COST or a BENEFIT?
- A cost (negative) → the market over-provides. Qm > Qs.
- A benefit (positive) → the market under-provides. Qm < Qs.
Those two answers give you the diagram and the diagnosis together.
Case 1 — Negative production externality
- Producing the good imposes a cost on third parties.
- Examples: a factory discharging into a waterway, dairy runoff into a river, noise or dust from a quarry, carbon emissions from a plant.
- SMC = MPC + external cost, so SMC lies ABOVE MPC. The benefit curves are unchanged, so MSB = MPB.
- Qm > Qs — the good is over-produced.
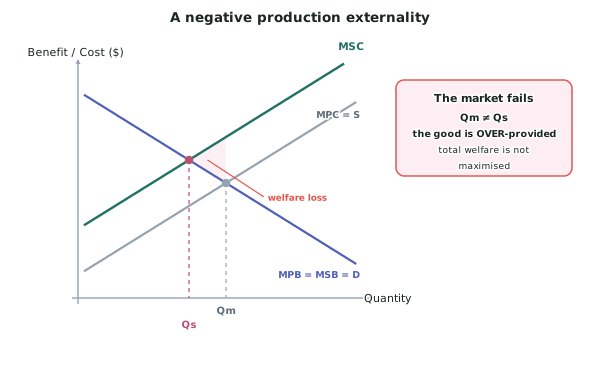
- Why: the producer pays only its private costs, so production looks cheaper than it is and it makes too much.
Case 2 — Negative consumption externality
- Consuming the good imposes a cost on third parties.
- Examples: second-hand smoke, alcohol-related harm to others, congestion from driving, litter.
- MSB = MPB − external cost, so MSB lies BELOW MPB. The cost curves are unchanged, so SMC = MPC.
- Qm > Qs — the good is over-consumed.
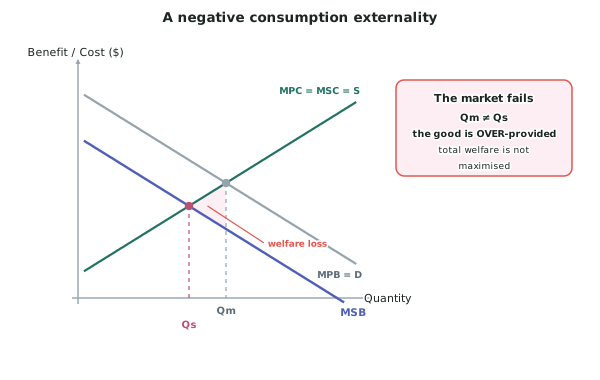
- Why: the consumer values the good at its private benefit to them, ignoring the harm their consumption does to others.
Case 3 — Positive consumption externality
- Consuming the good gives a benefit to third parties.
- Examples: vaccination, education, home insulation, planting street trees.
- MSB = MPB + external benefit, so MSB lies ABOVE MPB. SMC = MPC.
- Qm < Qs — the good is under-consumed.
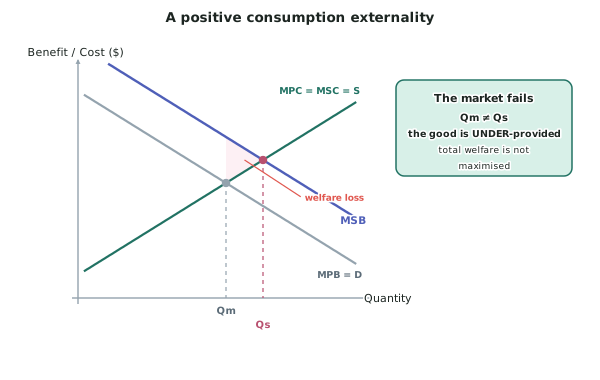
- Why: the consumer only counts the benefit to themselves when deciding whether to buy, so they buy less than society would want.
- This case overlaps with merit goods. A merit good is under-consumed both because of a positive externality and because consumers undervalue the private benefit to themselves.
Case 4 — Positive production externality
- Producing the good gives a benefit to third parties.
- Examples: a firm's research and development that other firms learn from, training that workers take with them, a beekeeper whose bees pollinate neighbouring orchards.
- SMC = MPC − external benefit, so SMC lies BELOW MPC. MSB = MPB.
- Qm < Qs — the good is under-produced.
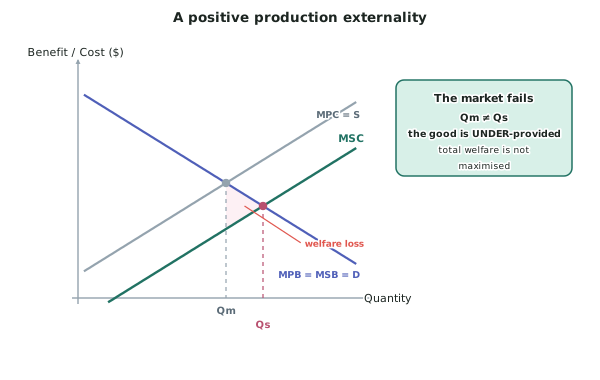
- Why: the producer cannot capture the benefit that spills over to others, so it under-invests relative to what society would want.
The summary table
| Case | Curve that moves | Direction | Result |
|---|---|---|---|
| Negative production | SMC vs MPC | SMC above | Qm > Qs — over-provided |
| Negative consumption | MSB vs MPB | MSB below | Qm > Qs — over-provided |
| Positive consumption | MSB vs MPB | MSB above | Qm < Qs — under-provided |
| Positive production | SMC vs MPC | SMC below | Qm < Qs — under-provided |
- Notice the pattern: negative → over-provided, positive → under-provided, regardless of whether it is production or consumption. Production or consumption decides which curve moves; the sign decides which way.
Where the welfare loss sits
- Always between Qm and Qs, bounded by SMB above and SMC below (or the reverse, depending on which is on top over that range).
- Its apex is at Qs, where the two social curves cross and the gap closes to zero.
- Negative cases: the loss is to the right of Qs, on units that should not have been made.
- Positive cases: the loss is to the left of Qs, on units that should have been made and were not.
Worked ExampleIdentifying and diagramming a positive consumption externality
An illustrative programme offers home insulation to households.
A household that insulates its home gains lower power bills and a warmer house. But there are also effects on others: fewer winter hospital admissions for respiratory illness, lower peak electricity demand which reduces prices for everyone, and lower carbon emissions.
Identify the type of externality, draw the model, and explain the market failure.
Step 1 — Question one: production or consumption?
The benefits to others arise from the household living in an insulated home — that is, from consuming the insulation, not from manufacturing it.
This is a consumption externality, so it moves the benefit curve. The cost curves are unchanged: SMC = MPC = S.
Step 2 — Question two: cost or benefit?
The effects on third parties are benefits:
- Fewer hospital admissions — a benefit to taxpayers who fund the health system, and to other patients who face shorter waits.
- Lower peak electricity demand — a benefit to every other electricity consumer, through lower prices.
- Lower carbon emissions — a benefit to everybody.
None of these accrues to the household paying for the insulation.
This is a positive consumption externality.
Step 3 — Build the model
Draw the private curves first:
- MPB — the demand curve, showing what insulation is worth to the household itself: lower power bills and a warmer house.
- MPC — the supply curve, showing what it costs installers to supply it.
They cross at Qm, the free market quantity.
Now add the social benefit curve:
MSB = MPB + external benefit
MSB lies ABOVE MPB, by the value of the health, electricity and emissions benefits per installation.
MSB crosses MPC at Qs, which is to the right of Qm.
Step 4 — State the diagnosis
Qm < Qs.
Insulation is under-consumed. Too few homes are insulated, and resources are under-allocated to insulation.
Step 5 — Explain why the market gets it wrong
A household deciding whether to insulate compares what it costs with what it gains — lower bills and a warmer house. That is MPB.
It does not count the value of the hospital admissions avoided, the lower electricity prices for others, or the emissions reduction, because none of that benefit comes back to it.
The household therefore values insulation at less than it is worth to society, and buys less than the socially optimal amount. Every household in the market makes the same rational calculation, so the market as a whole under-provides.
Step 6 — Identify the welfare loss
Over the range from Qm to Qs, the MSB curve lies above the MPC curve. Each of those installations would be worth more to society than it costs to supply.
They do not happen, so the welfare they would have created is never generated. The welfare loss is the triangle bounded by MSB above, MPC below, between Qm and Qs, with its apex at Qs.
Note that in a positive externality the loss sits to the left of Qs — it is welfare forgone, not welfare destroyed.
Step 7 — State it as an efficiency and an equity failure
Efficiency. The market produces at Qm where MPB = MPC, not at Qs where MSB = SMC. Total welfare is not maximised and a welfare loss exists. The market has failed on efficiency.
Equity. The households least likely to insulate are those on low incomes, because the upfront cost is large relative to what they can afford, even though they gain the most from warmer homes and lower bills. The households in the coldest, dampest homes are therefore the ones the market is least likely to serve — an equity failure on top of the efficiency one.