What market failure is, and the SMB/SMC model
What market failure means
- Market failure occurs when a free market, left alone, does not allocate resources efficiently or equitably.
- Note the "or" — the standard covers both. A market can fail on efficiency, on equity, or on both.
Efficiency failure
- A market is allocatively efficient when it produces the quantity at which total welfare is maximised.
- At Level 3 that condition is written using social rather than private values:
Social marginal benefit (SMB) = Social marginal cost (SMC)
- Social marginal benefit — the benefit of one more unit to everybody, including third parties.
- Social marginal cost — the cost of one more unit to everybody, including third parties.
- If the market produces at a quantity where SMB ≠ SMC, resources are misallocated and there is a welfare loss.
Private versus social
This is the distinction the entire standard rests on.
| Private | Social | |
|---|---|---|
| Benefit | MPB — benefit to the consumer who buys it. This is the demand curve. | MSB — benefit to the consumer plus any benefit to third parties |
| Cost | MPC — cost to the producer who makes it. This is the supply curve. | SMC — cost to the producer plus any cost imposed on third parties |
- A free market settles where MPB = MPC — where demand crosses supply — because that is what buyers and sellers act on. Call that quantity Qm.
- Society's best outcome is where SMB = SMC. Call that quantity Qs.
- Whenever Qm ≠ Qs, the market has failed on efficiency, and the gap between them measures the failure.
The SMB/SMC model
The NZQA clarification is explicit: for an externality, the ordinary Level 2 supply-and-demand diagram is not appropriate. You must draw the social curve alongside the private one, so the divergence is visible.
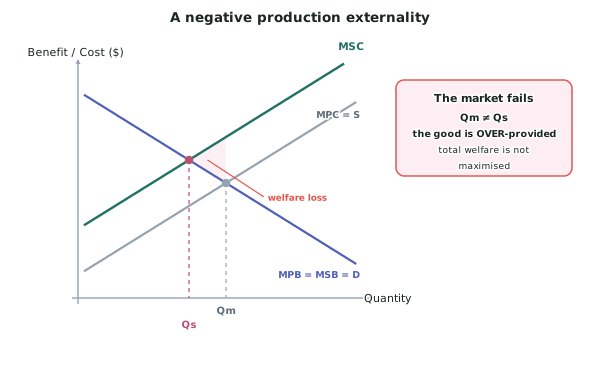
How to draw it, every time:
- Draw the private curves — MPB (the demand curve) and MPC (the supply curve) — and mark where they cross as Qm.
- Ask which one the externality affects. A production externality moves the cost curve; a consumption externality moves the benefit curve.
- Draw the social curve, offset by the size of the external effect.
- Mark where the two social curves cross as Qs.
- Shade the welfare loss triangle between Qm and Qs.
Equity failure
- Equity is about fairness in the distribution of income, wealth and access.
- A market can be perfectly efficient and still produce an outcome society judges unfair, because the market allocates by willingness and ability to pay, and ability to pay depends on income.
- The three equity-based failures in the standard are:
- Inequitable income and/or wealth distribution — modelled with the Lorenz curve.
- Under-provision of a merit good or service — including inequitable access to housing, property, national walking tracks and public infrastructure.
- Some externality and public good cases, where the burden falls unequally.
Why you need both
- The standard requires the implications of every intervention to be explained for both equity and efficiency, as implications for society.
- The two frequently point in different directions, and that tension is what an Excellence recommendation has to resolve.
Worked ExampleDiagnosing a market failure with the SMB/SMC model
An illustrative timber processing plant discharges waste into a river. Downstream, a fishing operation loses catch and residents cannot swim at the local beach.
The plant's private costs and the market outcome are:
| Quantity (thousand tonnes) | MPB ($/t) | MPC ($/t) | External cost ($/t) |
|---|---|---|---|
| 20 | 260 | 140 | 60 |
| 30 | 220 | 180 | 60 |
| 40 | 180 | 220 | 60 |
| 50 | 140 | 260 | 60 |
Identify the market quantity and the socially optimal quantity, and explain the market failure using the SMB/SMC model.
Step 1 — Identify the type of failure
The harm is caused by the act of producing — discharging waste is part of the production process. This is a negative production externality.
The cost falls on third parties — the fishing operation and local residents — who are neither the buyer nor the seller and who receive no compensation.
Step 2 — Find the market quantity, Qm
The free market settles where MPB = MPC, because that is what buyers and sellers actually respond to.
Reading the table, MPB and MPC cross between 30 and 40 thousand tonnes. Interpolating:
At 30: MPB 220, MPC 180 — MPB is above MPC, so more is produced. At 40: MPB 180, MPC 220 — MPB is below MPC, so that is too much.
Qm ≈ 35 thousand tonnes, at a price of about $200 per tonne.
Step 3 — Build the social marginal cost curve
SMC = MPC + external cost
| Quantity | MPC | External cost | SMC |
|---|---|---|---|
| 20 | 140 | 60 | 200 |
| 30 | 180 | 60 | 240 |
| 40 | 220 | 60 | 280 |
| 50 | 260 | 60 | 320 |
Because this is a production externality, only the cost curve is affected. Nobody outside the market gains or loses from the consumption of the timber, so MSB = MPB — the benefit curves are the same.
Step 4 — Find the socially optimal quantity, Qs
Society's best outcome is where SMB = SMC.
At 20: SMB 260, SMC 200 — SMB is above SMC, so more should be produced. At 30: SMB 220, SMC 240 — SMB is below SMC, so that is too much.
Qs ≈ 25 thousand tonnes.
Step 5 — State the diagnosis
Qm ≈ 35 > Qs ≈ 25.
The market over-produces timber by about 10 thousand tonnes. Resources are over-allocated to this industry.
Step 6 — Explain why the market gets it wrong
The plant makes its production decision by comparing what it receives with what it pays. It pays for logs, labour, energy and machinery — its private costs, MPC.
It does not pay for the lost fishing catch or the unusable beach. That $60 per tonne is a genuine cost of producing the timber, but it lands on third parties rather than on the firm.
Because the plant's decision is based on MPC rather than SMC, it treats production as $60 per tonne cheaper than it really is — and produces more of it than is worth producing.
Step 7 — Measure the welfare loss
Over the range from Qs = 25 to Qm = 35, the SMC curve lies above the SMB curve. Every one of those 10 thousand tonnes costs society more than it is worth to society.
The welfare loss is the triangle between the SMB and SMC curves over that range:
At Qm = 35, the vertical gap between SMC and SMB is approximately $60. Base = 10 thousand tonnes, height ≈ $60.
Welfare loss = ½ × 10,000 × $60 ≈ $300,000
That value is destroyed — it goes to nobody. The firm and its customers gain from those tonnes, but by less than the third parties lose.
Step 8 — State it as an efficiency and an equity failure
Efficiency. The market produces where MPB = MPC rather than where SMB = SMC, so total welfare is not maximised and a welfare loss of about $300,000 exists. The market has failed on efficiency.
Equity. The firm and its customers receive the benefit of the timber, while the fishing operation and local residents bear the cost of the pollution without compensation and without having agreed to it. The gains and the costs fall on different people, and that is an equity failure as well as an efficiency one.