Writing a report on unemployment in New Zealand
What the report is
- A written report on unemployment in New Zealand, built up over several weeks with access to data and resources.
- Your teacher sets the context. What follows is what the report has to contain, whatever context is chosen.
The three jobs the report does
1 — Define the unemployment concepts
- The HLFS definition of unemployment: without paid work, available, actively seeking.
- The labour force, participation rate and unemployment rate, with the formulas.
- Different definitions: the official rate against the broader underutilisation measure; full employment as no cyclical unemployment rather than zero.
- Types of involuntary unemployment: cyclical, structural, frictional, seasonal, regional.
2 — Explain causes of changes in unemployment using economic models
- The labour market model — which curve shifted and why, and what happened to We and Le.
- The AS/AD model — the link to aggregate demand and real GDP.
- The PPF — a point inside the frontier, and what that costs.
- The model is not optional. A cause explained without one names a mechanism instead of showing it.
3 — Explain impacts of changes in unemployment on groups in New Zealand society
- Choose specific groups — the unemployed, workers who keep their jobs, firms, the government, particular regions, young workers.
- "Various" means more than one.
What a complete report contains
Doing those three jobs is where a report starts, not where it finishes. Two more things have to be in it.
- Full chains of reasoning, not assertions. Carry every cause and every impact all the way through — export demand fell, so firms' sales fell, so demand for labour shifted left, so employment fell. A claim with the middle removed states a conclusion without showing how it was reached.
- Comparisons, with the models inside them. Causes weighed against each other by their effect on unemployment; impacts weighed across groups; and the changes shown on the models used as part of those explanations rather than illustrated beside them.
What "integrating the model" actually means
- Not integrated: a diagram on one page, and a written explanation on another that never mentions it.
- Integrated: the explanation uses the model's own labels as it goes.
"Falling export demand reduces firms' sales, and since labour demand is derived demand, demand for labour shifts left from DL to DL1. At the new equilibrium the wage falls from We to We1 and employment falls from Le to Le1 — the fall from Le to Le1 is the cyclical unemployment created."
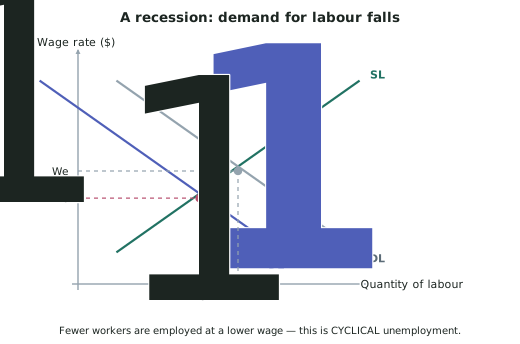
- Every named label in that sentence is doing work. Every label the sentence names — DL, DL1, We, We1, Le, Le1 — is on the diagram above. That is integration.
Practical advice for the report
Use real New Zealand data, and cite it.
- Stats NZ publishes the HLFS quarterly: unemployment rate, employment, participation rate, underutilisation.
- Look the current figures up rather than relying on a number in a textbook. Unemployment data moves every quarter, and a stale figure undermines the argument built on it.
- Reference where each figure came from and its date.
Draw the models yourself and label them fully.
- Both axes, both original curves, the shifted curve with a subscript, arrows showing the direction, and both new equilibrium values.
- An unlabelled diagram shows nothing, because there is no way to say what moved or how far.
Structure the report around those three jobs.
- Define the concepts and present the data
- Causes — each explained with a model
- Impacts — on named groups
- Comparisons — which cause mattered more, and which group was worse affected
- A conclusion that states a judgement
Write the comparisons deliberately. They are the whole of the analysis, and they will not appear by accident. Plan two: one comparing causes, one comparing groups.
Worked ExampleTurning a thin paragraph into an analysis
A student has written this paragraph in their report:
"Unemployment rose because of the recession. This is cyclical unemployment. It affected many workers who lost their jobs and had less income. The government also had to pay more benefits."
Rewrite it so that it explains with models, compares, and reaches a judgement.
Step 1 — Diagnose what is missing
The paragraph states four things and explains none of them. Specifically it has:
- No model. "Because of the recession" is not a mechanism.
- No detail. The impacts are named, not explained.
- No comparison. Nothing is set against anything else.
- No judgement.