Connecting graphs, equations and contexts
What "connecting representations" means
-
The standard names "connecting different representations of relations" as one of its methods.
-
The four representations of the same relationship are:
- a table of values
- a graph
- an equation
- a description in words or a real context
-
Merit and Excellence are earned by moving between them, not by working within one. A question that gives you a context and asks for a graph is testing exactly this.
Choosing the right family for a context
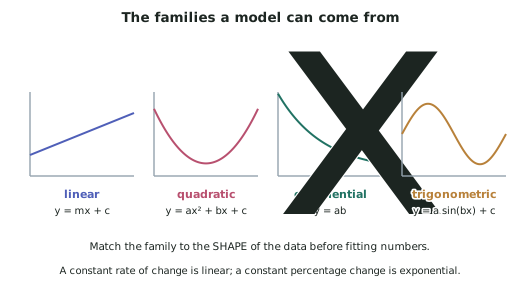
- Learn these shapes by sight. Most of the marks in this topic come from matching the shape of the data to the right family before any algebra begins — a model from the wrong family cannot be rescued by good arithmetic.
- Reading the situation tells you the family before any algebra:
| Situation | Family |
|---|---|
| A constant rate of change | Linear |
| A quantity changing by a fixed percentage each period | Exponential |
| Something thrown or dropped; area against a length | Quadratic |
| Volume against a length | Cubic |
| Two quantities with a constant product (fixed area, fixed distance) | Hyperbolic |
| Something that grows quickly then flattens off | Logarithmic |
- The give-away for exponential is "per cent" or "doubles" or "halves". The give-away for hyperbolic is "the more of one, the less of the other, with the product fixed".
Building a model from data
-
Identify the family from the wording or the shape of a plot.
-
Write the general form with unknown constants.
-
Substitute the given data points to make equations.
-
Solve for the constants.
-
State the model, and state its practical domain.
-
Worked through — a population is 500 at the start and grows 8% a year:
- Exponential, so
- (the starting value) and (the multiplier)
- , valid for
Interpreting the features in context
- Every graphical feature means something in the situation, and saying so is what earns Merit:
| Feature | Typical meaning |
|---|---|
| -intercept | the starting value, at time zero |
| -intercept | when the quantity reaches zero |
| Gradient | the rate of change, with units from the axes |
| Vertex (maximum) | the greatest value, and when it occurs |
| Vertex (minimum) | the least value |
| Horizontal asymptote | a limiting value the quantity approaches |
| Vertical asymptote | a value the input can never take |
- Give the units. "The gradient is " is incomplete; "the volume falls by 4 litres per minute" is the answer.
Stating the practical domain
- The mathematical domain is what the equation allows; the practical domain is what the situation allows.
- A model for a ball works only while the ball is airborne, so .
- Beyond the practical domain the mathematics keeps producing numbers, but they describe nothing. Saying where a model stops applying is a genuine Excellence-level observation.
Evaluating a model
-
At Excellence you may be asked whether a model is reasonable:
- Does it fit the data at the points you were given?
- Does it behave sensibly between and beyond them?
- What does it predict at extreme values, and is that plausible?
- What assumptions does it make?
-
An exponential population model, for instance, predicts unbounded growth — which cannot continue indefinitely with finite food and space. Naming that limitation is worth more than another calculation.
Reading a graph accurately
- Check the scales on both axes before reading anything. They are often different, and often do not start at zero.
- Read the axis labels and units.
- Interpolating — reading between plotted points — is usually reasonable; extrapolating beyond the data is much less reliable.
Worked ExampleBuilding and evaluating a model
A cup of tea cools from 90 °C. After 5 minutes it is 60 °C, and after 10 minutes it is 45 °C. The room is at 20 °C. Show that an exponential model of the form fits, find and , predict the temperature after 20 minutes, and comment on the model's limitations.
Step 1 — Identify why the family fits
The tea cools towards the room temperature but never below it, so the temperature should approach a horizontal asymptote at .
That is exactly the shape of an exponential decay shifted up by 20 — which is why the model is written rather than .
Step 2 — Use the starting value to find
At the tea is 90 °C, and :
is the initial temperature difference — how far above room temperature the tea starts. That is the quantity that decays.
Step 3 — Use the second data point to find
At , :
Take the fifth root:
Step 4 — Test the model against the third data point
This is the check that decides whether the model actually fits. At :
The measured value was 45 °C, and the model predicts 42.9 °C.
Step 5 — Predict the temperature after 20 minutes
Step 6 — Interpret the features in context
- -intercept (90 °C): the temperature when the tea was poured
- Horizontal asymptote (): the room temperature — the tea cools towards it but, according to the model, never quite reaches it
- : each minute the tea retains about 89.4% of its temperature difference above the room, losing 10.6% of the gap
- Range: , so the model never predicts the tea cooling below room temperature ✓ physically sensible
Step 7 — Comment on the limitations
- The fit is imperfect. The 10-minute prediction is 2 °C low, so the model is a simplification rather than an exact description.
- The asymptote is never reached. In reality the tea does reach room temperature, at least to the precision of any thermometer; the model only says it gets arbitrarily close.
- The room is assumed to stay at exactly 20 °C, and the cooling rate is assumed to depend only on the temperature difference — ignoring draughts, the cup's material, evaporation and whether the tea is stirred.
- Extrapolating far beyond the data is unsafe. The three measurements span 0–10 minutes; the 20-minute prediction is a genuine extrapolation and should be treated as approximate.
- The practical domain is , since negative time is before the tea was poured and the model says nothing about it.