Linear and quadratic graphs
Linear graphs
- A linear equation produces a straight line:
-
— the gradient: positive rises, negative falls, zero is horizontal
-
— the -intercept, where the line crosses the vertical axis
-
To sketch a line quickly, plot the -intercept and use the gradient as a step: from , go 1 right and up.
-
The -intercept is found by setting and solving.
-
A vertical line is not a function, because one -value has many -values. It fails the vertical line test.
Quadratic graphs
- A quadratic produces a parabola — a symmetric U or ∩ shape:
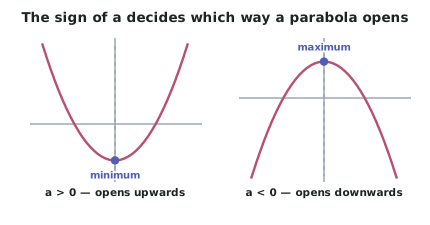
- The sign of decides which way it opens:
- — opens upwards, with a minimum
- — opens downwards, with a maximum
- The size of decides how narrow it is. A large gives a steep, narrow parabola.
- is the -intercept, since setting leaves only .
The three forms of a quadratic
-
Each form displays a different feature immediately. Choosing the right one is most of the skill.
-
General form:
- Shows the -intercept () at a glance.
-
Factorised form:
- Shows the -intercepts at and .
- The axis of symmetry is midway between them: .
-
Completed-square (vertex) form:
- Shows the vertex directly at .
- Watch the sign: has its vertex at , and at .
Finding the vertex
- From factorised form: average the two roots to get the -coordinate, then substitute for .
- From general form: the axis of symmetry is
then substitute to find .
-
From completed-square form: read it straight off.
-
Worked through for :
- Factorised: , so the roots are 1 and 5
- Axis of symmetry:
- Vertex: , so
- Or by completing the square: , giving the vertex directly ✓
How many -intercepts
-
The discriminant counts the crossings:
- — two -intercepts
- — one; the parabola touches the axis at its vertex
- — none; the parabola misses the axis entirely
-
Note that a parabola with no -intercepts still has a -intercept and a vertex — it simply sits entirely above or entirely below the axis.
Domain and range
-
Domain — the set of -values the function accepts.
-
Range — the set of -values it produces.
-
For a line (non-vertical): domain is all real ; range is all real .
-
For a parabola: domain is all real ; the range is limited by the vertex:
- : range is
- : range is
-
The vertex is what makes the range interesting. A parabola cannot produce values beyond its turning point, which is why the range is a half-line rather than everything.
Worked ExampleReading every feature from a quadratic
For , find the intercepts, the vertex, the axis of symmetry, and the range. Sketch the graph.
Step 1 — Identify the family and direction
The highest power is 2, so the graph is a parabola.
so it opens downwards and has a maximum.
Step 2 — Find the -intercept
Set :
-intercept: — which is just the constant term.
Step 3 — Find the -intercepts
Set and factorise. First take out the common factor :
-intercepts: and
Step 4 — Find the axis of symmetry
A parabola is symmetric about the line midway between its roots:
Axis of symmetry:
Check with the formula: ✓
Step 5 — Find the vertex
The vertex lies on the axis of symmetry, so substitute :
Vertex: — and since the parabola opens downwards, this is a maximum.
Step 6 — State the domain and range
Domain: a quadratic accepts every real input, so
Range: the parabola opens downwards with a maximum of 8, so it produces every value up to and including 8:
Step 7 — Describe the sketch
The graph is a downward-opening parabola:
- rising from the lower left, crossing the -axis at
- reaching a maximum at
- falling back through and away to the lower right
- crossing the -axis at
Symmetry check: is 3 units left of the axis , so its mirror image is at . Testing: ✓ The symmetry holds.