Spatial and temporal variation
The two aspects, and what each one asks
- The standard names two aspects: how the process creates spatial and/or temporal variations, and how it has impacted on people and the environment(s).
- A spatial variation is a difference the process makes from place to place. The core question is where does it operate, and where does it not?
- A temporal variation is a difference the process makes over time. The core question is when did it speed up, and what changed then?
- Past papers have asked for either one, and 2024's stem asked explicitly for spatial OR temporal — so you must be able to do both and choose fast.
- The strongest answers treat the boundary as the evidence. Both kinds of variation are really about a line: a line on the map, or a line on a graph.
Spatial variation: draw the boundary and say what sets it
- Start by finding the edge of the process, not its centre. Anyone can describe where dairying is; the analysis is in why it stops where it does.
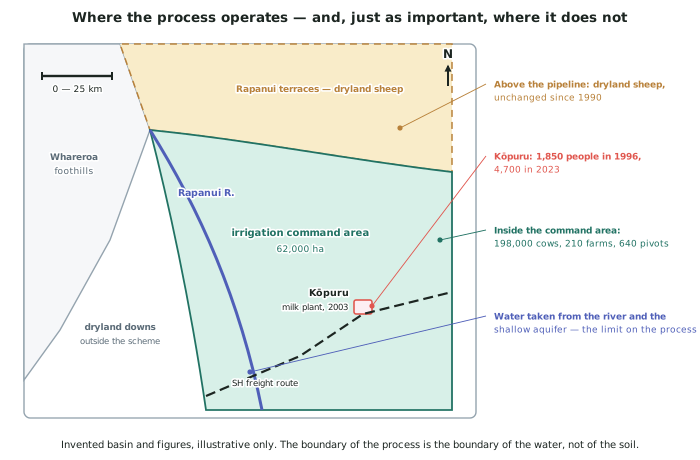
- In the invented Te Rapanui Basin the boundary is not the soil and not the rainfall — it is the pipeline. Inside the irrigation command area there are 62,000 ha of dairy, 210 farms, 640 pivots and 198,000 cows; above the pipeline on the Rapanui terraces the land is still dryland sheep, essentially unchanged since 1990.
- The unchanged area is evidence, not an empty space. It is the control that proves what the process needed: the terraces have similar soils and similar climate, and the only thing they lack is consented water.
- Name the second-order pattern too. Within the command area, conversion happened first within 8 km of the Kōpuru plant, because milk cannot travel far cheaply.
- Say what the pattern means for people. Two farms 3 km apart, one inside and one above the command area, now have different land values, different labour needs and different futures.
Temporal variation: find the phases, not the trend
- A cultural process almost never runs at a steady rate. Describing it as increasing since 1990 throws away the whole aspect.
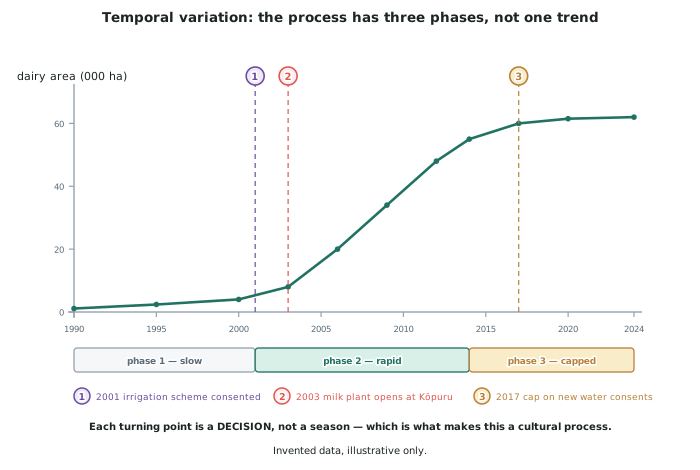
- Break the history into phases and give each one a rate. In the invented basin there are three: slow to 2001 (1,100 → 4,000 ha in eleven years), rapid 2003–2014 (8,000 → 55,000 ha), and capped since 2017 (60,000 → 62,000 ha in seven years).
- Then find what changed at each boundary. The 2001 irrigation scheme consent, the 2003 plant opening, the 2017 cap on new consents.
- Every one of those is a decision. That is what makes the variation cultural rather than natural — the turning points are choices, not seasons.
- Give the dates and the figures. A phase without a rate attached is a label.
Linking the two, which is where the marks jump
- Spatial and temporal variation are usually the same decision seen twice. The consent that fixed the boundary on the map is the consent that fixed the turning point on the graph.
- In the invented basin, the 2017 cap did both: it flattened the curve and it froze the boundary of the command area. Everything above the pipeline stayed dryland because of the same decision that stopped the growth.
- Use one to predict the other. If you know the process paused in 2017, you know there should be a visible edge that has not moved since 2017 — and there is.
- This is the reliable route to insight in this standard, because it is a link between elements (rules and technology) with a conclusion drawn from it.
Writing the variation paragraphs
- One paragraph per variation, with the same four moves each time: state the variation → give the figures on both sides → name the element that produced it → say what follows for people or the environment.
- Use both sides of every comparison. Inside and outside; before and after. A figure with nothing to compare it to is not evidence of variation.
- Quantify the difference, not just the levels. 62,000 ha against effectively zero above the pipeline is stronger than two separate numbers.
- Do not describe the whole environment. You are describing the variation the process created, which is a smaller and more specific thing.
Worked Example
Worked example
Explain how a cultural process you have studied has created spatial variation in a geographic environment.
Two attempts, then the version that reaches Excellence.
- Attempt 1: Dairying has spread across the Te Rapanui Basin, so there is more of it in some areas than others.
- Attempt 2: There are 62,000 ha of dairy in the Te Rapanui Basin, mostly on the plains. The hill country still has sheep.
Answer:
Step 1 — diagnose the attempts.
Attempt 1 has no figures, no places and no boundary — it says only that things differ. Attempt 2 has one figure and a rough location, but it explains the pattern by implying that hills are the cause, which is not what the map shows.
Step 2 — find the actual boundary.
The dairy area stops at the edge of the irrigation command area, which follows the pipeline, not the break of slope. Some flat land above the pipeline is still dryland sheep, and some steeper land inside the scheme has been converted. The boundary is the water, not the terrain.
Step 3 — put figures on both sides.
Inside: 62,000 ha, 210 farms, 640 pivots, 198,000 cows. Above the pipeline: dryland sheep on similar soils, essentially unchanged since 1990.
Step 4 — name the element that produced the boundary.
The water consent — the rules element. Rainfall in the basin is 620 mm a year, too low for the pasture growth dairying needs, so without a consent the conversion cannot be financed at all.
Step 5 — write the Excellence version.
The spatial variation created by intensification in the Te Rapanui Basin is unusually sharp, and its sharpness is the evidence for what caused it. Inside the irrigation command area there are 62,000 ha of dairy, 210 farms and 198,000 cows watered by 640 centre-pivot irrigators; immediately above the pipeline, on the Rapanui terraces, the land carries dryland sheep and is essentially unchanged since 1990.
The two areas share their soils, their 620 mm of rainfall and their distance to the Kōpuru plant. The only element present on one side and absent on the other is a consented water supply, and the boundary between them follows the pipeline rather than any natural feature — in places it cuts across a single flat paddock.
So the pattern is not agricultural, it is regulatory. A line drawn in a council consent process is now the most visible line in the landscape: it separates land worth $8,400/ha from land worth a fraction of that, farms that employ year-round staff from farms that do not, and a catchment where median groundwater nitrate has risen from 2.1 to 6.8 mg/L from one where it has not. The environment is being shaped less by where farming is possible than by where it is permitted.