Writing the aim and planning the fieldwork
What a usable aim looks like
- An aim is one sentence containing a variable, a set of places and a verb. How and why does channel width change between the Kotarehu foothills and the coast? has all three: width, six sites, change.
- Include the word why, or an equivalent. An aim that only asks what invites a description, and a report that only describes cannot reach Merit.
- Name the boundary of your study area in the aim. Between the foothills and the coast tells the marker where the study starts and stops, and it stops you collecting data you will not use.
- Break the aim into three to five sub-questions. They become the sections of your findings, so writing them now saves a rewrite later.
Choosing your sites
- Sites are your spatial component, so choose them deliberately and write down the reason for each one. A marker can see the difference between six chosen sites and six convenient ones.
- Space them evenly if you can. Even spacing makes distance a clean axis on a graph, so any trend you find belongs to the environment rather than to your walking route.
- Cover the full range of the variable. If land use changes between the centre and the edge of town, you need sites at both ends, not five in the middle.
- Check access, safety and permission for every site before the field day. A site you cannot reach becomes a gap in the middle of your graph.
- Record each site's location precisely — a grid reference, a GPS coordinate, or a distance from a fixed landmark. A site you cannot relocate cannot be re-measured and cannot be mapped.
Sampling design — the choice you must justify
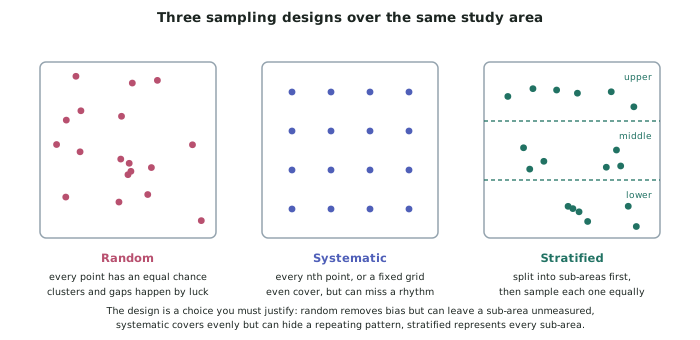
- Sampling is choosing which parts of the study area you actually measure, because you can never measure all of it.
- Random sampling gives every point an equal chance of selection, usually by generating coordinates.
- Strength: it removes your own bias completely.
- Weakness: by chance it can cluster in one corner and leave a whole sub-area unmeasured.
- Systematic sampling takes every nth point, or a fixed grid, or fixed intervals along a line.
- Strength: even cover, simple to run, easy to explain.
- Weakness: if the environment has a rhythm the same length as your interval, you can miss it entirely — measuring every 20 m along a street of 20 m shopfronts can land on the same shop type every time.
- Stratified sampling divides the area into sub-areas first, then samples each one.
- Strength: it guarantees every sub-area is represented, in proportion if you want.
- Weakness: it needs you to know the sub-areas in advance, and if you divide them wrongly you build your assumption into the data.
- Write your design and your reason into the plan. Systematic, every 2 km, because distance downstream is the variable I am explaining with is a justified design. We measured where we could park is not.
The method plan
- A method plan is a table with one row per variable. The columns are: what is measured, how, with what equipment, how many repeats, who does it, and how it is recorded.
- Combine methods — the standard requires it. The named options are observing, measuring, précis sketching, photographing, surveying, questionnaires, interviewing and accessing secondary sources.
- Define your measurements exactly, in advance. Depth is meaningless; depth in centimetres at five points evenly spaced across the channel, averaged can be repeated by someone else, which is what makes it reliable.
- Decide repeats now. Three velocity timings averaged is a defensible number; one is a guess with a decimal point on it.
- Design your recording sheet before the day, one row per site and one column per variable, and print spares.
- Start a field log on the same clipboard — weather, times, equipment problems, sites moved, refusals. This is the raw material of your evaluation.
Safety, ethics and permission
- Complete a risk assessment for each site — water depth and flow, traffic, tides, weather, and how you would get help. Schools require this and the standard's process credit rewards it.
- Get permission for private land, and record who gave it.
- Questionnaires need ethics. State who you are and why you are asking, keep responses anonymous, and let people decline.
- Do not damage the environment you are studying. Trampled banks and moved stones change the next group's data and yours.
Worked Example
Worked example
A student's first draft plan for the invented Waipuna Stream study reads:
Aim: to look at the Waipuna Stream. Method: go to the river and measure it. Sampling: pick some good spots.
Rewrite this as a plan that would be approved.
Answer:
Step 1 — fix the aim, because everything else depends on it.
To look at names no variable, no places and no verb. Replaced with: How and why does the channel of the Waipuna Stream change between the Kotarehu foothills and the coast? That gives a variable set, a boundary and the word why.
Step 2 — turn it into sub-questions, which become the findings sections.
- How do width, depth, velocity and bedload change with distance downstream?
- Which change most sharply, and where?
- What processes explain the changes?
- Does residents' concern about flooding vary with distance from the channel?
Step 3 — fix the sampling, and give the reason.
Pick some good spots is selection bias written down. Replaced with systematic sampling: six sites, 2 km apart, from site 1 in the foothills to site 6 at the tidal limit, because distance downstream is the variable the explanation will use, so it must be evenly spaced. For the questionnaire, stratified sampling: ten respondents in each of four streets at increasing distance from the channel, so every distance band is represented.
Step 4 — write the method table.
| Variable | How | Equipment | Repeats |
|---|---|---|---|
| Channel width | Tape across the water surface, bank to bank | 30 m tape | 1 per site |
| Depth | Metre rule at 5 evenly spaced points, averaged | metre rule | 5 per site |
| Velocity | Time a float over 10 m, averaged | float, stopwatch, tape | 3 per site |
| Bedload | Long axis of 10 stones grabbed without looking | callipers | 10 per site |
| Site character | Précis sketch and one photograph facing upstream | clipboard, phone | 1 each |
Step 5 — add what the first draft had no room for: a risk assessment per site, a field log for weather and problems, and the council flood record as a referenced secondary source.