Collecting and recording data in the field
The eight methods, and the rule that they must be combined
- The standard names eight collection methods: observing, measuring, précis sketching, photographing, surveying, questionnaires, interviewing and accessing secondary sources.
- Your collection must combine methods from that list. One method used well is still one method, and a report built on a single technique is not a research project.
- Two or three used properly is enough. A stream study that measures, sketches and photographs at each site has combined three, and adds a fourth with a questionnaire.
- Primary data must come from the field. Secondary sources sit alongside your own data, never in place of it.
- Choose methods that answer different sub-questions. Measuring answers how much; sketching answers what does the site look like; a questionnaire answers what do people think.
Measuring and observing
- Measuring produces numbers with units, and it is the backbone of most projects because it can be graphed and mapped.
- Follow your defined method exactly, every site, every time. A method changed halfway through produces data that cannot be compared, and that is worse than missing data.
- Take the repeats you planned. Averaging three readings tells you whether a difference between sites is real or is your stopwatch.
- Observing produces categories, not numbers — land use type, building condition, channel shape, vegetation cover.
- Make observation systematic by writing the categories in advance. A tally sheet with residential / retail / industrial / vacant / other printed on it turns an opinion into data, because every observer applies the same list.
- Record the time of every observation. Pedestrian and traffic counts change through the day, and a time-stamped count can be defended.
Précis sketching and photographing
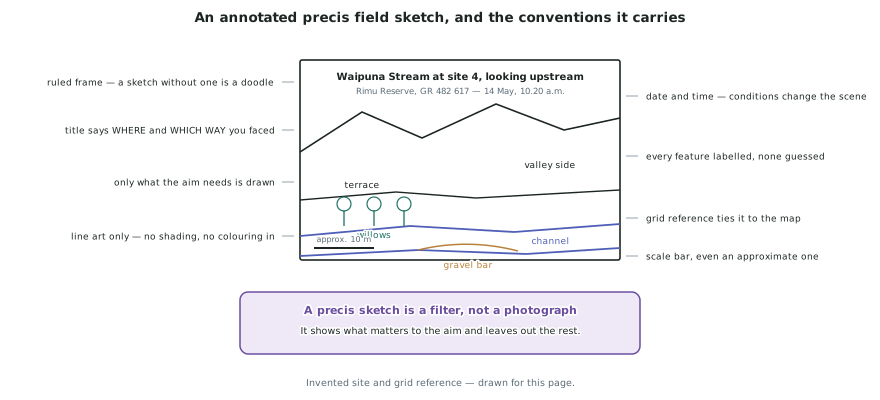
- A précis sketch is a simplified field drawing that keeps only what matters to the aim. That filtering is exactly why it counts as data and a snapshot often does not.
- The conventions are fixed, and a sketch missing them is a doodle:
- a ruled frame
- a title saying where you are and which way you are facing
- the date and time
- a grid reference or other precise location
- a scale bar, even an approximate one
- labels on every feature you have drawn
- Draw in line only. No shading, no colouring in, no artistic detail — a précis sketch is a diagram, not a picture.
- Photographs are data when they are captioned like data. Every photograph needs a location, a date, a time, the direction faced and a sentence saying what it shows and why it is in the report.
- Take the same photograph at every site, from the same angle and distance where you can. A set of comparable images is evidence of a pattern; a scrapbook of nice views is not.
- A sketch beats a photograph when the important thing is hidden, such as a terrace edge lost in vegetation.
Questionnaires, surveys and interviews
- A questionnaire is a fixed set of questions asked of many people; an interview is a longer conversation with a few. Use the first for pattern, the second for depth.
- Keep most questions closed — yes/no, a category, or a scale of 1 to 5 — because closed answers can be counted, graphed and mapped.
- Add one or two open questions for the quotations that make your findings readable.
- Ask one thing per question, and avoid leading ones. Do you think the stream is dirty and dangerous? cannot be answered by someone who thinks it is one but not the other, and do you agree the council has neglected the stream? collects your own opinion back.
- Record where each response came from. A questionnaire with no location attached has no spatial component, so it cannot be mapped and loses most of its value in this standard.
- Record refusals as well as responses. Twelve refusals in one street and none in another is a finding, and it belongs in your evaluation.
Secondary sources, and recording so the data survives
- Secondary sources are anything collected by someone else — council reports, Stats NZ data, historic photographs, published maps, newspaper archives.
- Reference every one: who produced it, what it is, and the date. Undated secondary data cannot be compared with your field day.
- Use them for the time dimension you cannot collect. You measured one day; a council record can tell you about the last twenty years.
- Fill your recording sheet in the field, not from memory in the car. Numbers remembered are numbers invented.
- Write units on the sheet, and use the same unit at every site — 14 m and 1,400 cm in one column produces a graph that lies.
- Photograph every completed sheet before you leave the last site.
- Keep the field log running all day. Weather, times, equipment problems, sites moved, refusals. Stage 7 is written from this log, and a log written afterwards is a guess.
Worked Example
Worked example
At site 4 of the invented Waipuna Stream study, a group records this:
Width: about 8. Depth: deepish. Velocity: quite fast. Stones: medium. Photo taken.
Rewrite this as a usable field record, and say what each fix protects.
Answer:
Step 1 — units and precision. About 8 has no unit and no precision. Width: 7.2 m, single tape reading at the water surface. This protects the graph: 7.2 can be plotted, about 8 cannot be distinguished from site 3's about 8.
Step 2 — replace judgements with readings. Deepish is an opinion. Depth: 34, 41, 47, 38, 30 cm at five evenly spaced points; mean 38 cm. Recording all five readings, not just the mean, protects the evaluation, because the spread shows how uneven the channel is.
Step 3 — apply the defined method to velocity. Quite fast becomes float over 10 m: 21.4 s, 22.8 s, 20.9 s; mean 21.7 s, so 0.46 m per second. Three timings protect the finding: the spread of 1.9 s tells me a difference of 0.05 m per second between sites is inside my own error.
Step 4 — make the categorical measurement countable. Stones: medium becomes bedload long axis: 48, 33, 62, 27, 55, 41, 38, 71, 29, 44 mm; mean 45 mm, ten stones grabbed without looking.
Step 5 — turn the photograph into data, and add the sketch. Photo taken becomes Photograph 4a, facing upstream from the true right bank, 14 May, 10.20 a.m., showing the gravel bar mid-channel. A précis sketch is added because the terrace edge behind the willows does not appear in the photograph, and the terrace is part of the explanation.
Step 6 — log the conditions. Field log: overcast, no rain in the previous 24 hours, tape blown sideways on the first attempt so the width reading was repeated.