Moving averages and finding the trend
Why you need a moving average
- The trend is the long-term direction, but you cannot see it clearly through the seasonal zigzag.
- A moving average removes the seasonal pattern by averaging over exactly one full cycle, so the highs and lows cancel out. What remains is the trend.
Choosing the order
- The order of the moving average must equal the length of the seasonal cycle.
| Data | Cycle | Moving average |
|---|---|---|
| Quarterly | 4 quarters | 4-point |
| Monthly | 12 months | 12-point |
| Daily with a weekly pattern | 7 days | 7-point |
- Using the wrong order leaves seasonal pattern in the trend, which is the commonest technical error in this internal. If your fitted trend still zigzags, check the order.
Odd and even orders
- With an odd order (5, 7), each average falls exactly on a data point, and no further work is needed.
- With an even order (4, 12), each average falls between two data points. This is why quarterly and monthly data need a centred moving average.
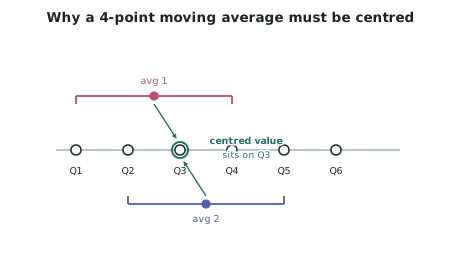
The centred moving average
- The procedure for quarterly data:
- Average quarters 1–4. This value sits between Q2 and Q3.
- Average quarters 2–5. This value sits between Q3 and Q4.
- Average those two averages. The result sits exactly on Q3.
- Equivalently, a centred 4-point moving average is a weighted average of five values with weights .
- The software does this for you. You need to understand what it produces and why, not compute it by hand — but being able to explain the centring is worth marks when asked how the trend was found.
What you lose at the ends
- A moving average cannot be calculated for the first and last few points, because there are not enough values on both sides.
- For a centred 4-point average you lose two points at each end.
- This matters for forecasting, because the most recent trend values — the ones a forecast depends on most — are the ones you do not have. Saying so is a genuine Excellence-level reflection on the method.
Describing the trend once you have it
- Plot the trend line on the same axes as the original series. This single graph is the most useful display in the whole report.
- Then describe it, with values:
- Direction and size: "The trend rises from about 410 units in early 2019 to about 520 in late 2023, an increase of roughly 27% over five years."
- Rate: "The rise averages about 22 units per year, and is close to linear."
- Changes: "The trend flattens between 2021 and 2022 before resuming its rise."
- Then explain each feature from the context. A flattening in the trend is a fact; a flattening caused by a supply disruption or a competitor entering the market is an explanation.
Common problems
| Problem | What it means | What to do |
|---|---|---|
| Trend still zigzags | Wrong moving average order | Match the order to the cycle length |
| Trend is very jagged | Order too short, or a noisy series | Check the order; comment on the variability |
| Trend is over-smoothed | Order longer than the cycle | Use exactly one cycle |
| A large jump in the trend | A level shift in the data | Investigate the cause and consider excluding that period |
Worked ExampleExplaining the trend section of a report
A student investigating quarterly sales of outdoor furniture at a New Zealand retailer has fitted a centred 4-point moving average. The trend rises from about $140 000 per quarter in 2018 to about $205 000 in 2021, is flat at around $205 000 through 2022, then rises again to about $240 000 by 2024.
Write the trend section of her report.