Seasonal effects and the deseasonalised series
What a seasonal effect is
- A seasonal effect is the average amount by which a particular quarter or month sits above or below the trend.
- In the additive model:
- Because the effect is an amount added to or subtracted from the trend, it is in the same units as the data — dollars, arrivals, kilowatt hours.
- A positive effect means that period is typically above trend; a negative effect means below.
How they are calculated
- The procedure the software follows:
- Subtract the trend from each data value, leaving the seasonal plus irregular components.
- Average these differences for each quarter across all the years — so all the Q1 differences are averaged to give the Q1 effect.
- Adjust so the effects sum to zero.
- Averaging across years is what removes the irregular component, leaving the systematic seasonal pattern.
The effects sum to zero
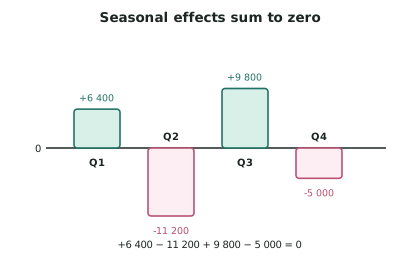
- In an additive model, the seasonal effects must sum to zero across one complete cycle.
- This is your check. If your four quarterly effects are , , and , they sum to zero ✓
- The reason is that a seasonal effect describes redistribution within the year, not a change in the annual total. What one quarter gains, others lose.
Interpreting them in context
- Always state the effect with its units and its meaning:
- "The Quarter 1 seasonal effect is , meaning that on average Quarter 1 sales are about $8 200 above the trend for that time."
- Then explain why, from the context. This pairing is where the Merit evidence comes from.
- Comparing effects is often revealing:
- "The gap between the Q1 effect () and the Q3 effect () is about $17 600, so seasonality moves sales by more than $17 000 between the best and worst quarters — a substantial planning consideration for a business of this size."
The deseasonalised series
- Deseasonalising removes the seasonal pattern so that periods can be compared fairly:
- What it is for: answering the question "is this quarter genuinely better, or is it just that Q1 is always good?"
- Official statistics are almost always published as seasonally adjusted figures for exactly this reason — Stats NZ reports seasonally adjusted employment and GDP so that quarter-to-quarter comparisons are meaningful.
- Plot the deseasonalised series. It should look like the trend plus random scatter, with no remaining zigzag. If a zigzag remains, the seasonal effects are wrong.
What the deseasonalised series is good for
| Use | Why |
|---|---|
| Comparing consecutive quarters | Removes the automatic seasonal advantage |
| Spotting a turning point early | A trend change shows up before the moving average catches it |
| Identifying unusual periods | A point far from the trend after deseasonalising is genuinely unusual |
| Checking the model | Remaining pattern means the seasonal effects are wrong |
Worked ExampleInterpreting seasonal effects
A student investigating quarterly domestic guest nights at a South Island alpine town has obtained these seasonal effects from an additive model:
| Quarter | Q1 (Jan–Mar) | Q2 (Apr–Jun) | Q3 (Jul–Sep) | Q4 (Oct–Dec) |
|---|---|---|---|---|
| Seasonal effect |
Write the seasonal effects section of her report.
Step 1 — Check the model's arithmetic