Moving averages and the trend
Smoothing out the season
- To see the trend clearly, average away the seasonal ups and downs with a moving average whose length equals the seasonal period — 4 for quarterly data, 12 for monthly.
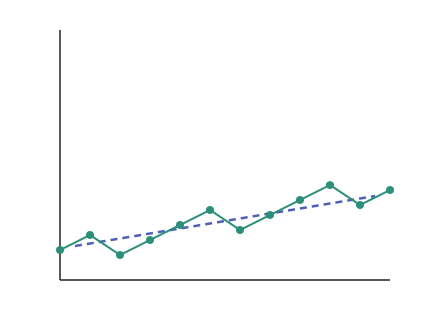
Centred moving averages
- With an even period like 4, a plain 4-point moving average falls between two quarters. To line it up with a quarter, take a centred moving average (CMA) — the average of two consecutive 4-point moving averages.
- The CMA values trace the trend with the seasonal pattern removed.
Reading the trend
- List or plot the CMA values — they reveal the underlying trend (for example, steadily rising).
- The CMA is smoother than the raw data, because the regular seasonal swings have been averaged out — that is exactly the point.
Quarterly sales for two years are (year 1) and (year 2). Find the centred moving averages and state the trend.
Step 1 — 4-point moving averages
Average each group of four consecutive quarters:
Step 2 — Centre them (average adjacent pairs)
Step 3 — State the trend
The centred moving averages rise steadily — an increasing trend of about 2 per quarter, with the seasonal swings removed.
Test yourself
Practice by grade
One question each at Achieved, Merit and Excellence. Have a go, then compare with the model answer.
Achieved
For quarterly data, how many values should a moving average be taken over, and why?
Merit
The 4-point moving averages of a quarterly series are . Find the centred moving averages.
Excellence
Explain why, for quarterly data, we centre the 4-point moving average instead of using it directly.