Time series plots, trend and seasonality
Time series data
- Time series data is a single numerical variable measured at regular time intervals — daily, monthly, quarterly or yearly.
- Plot it as a time series plot: time on the horizontal axis, the variable on the vertical, with the points joined in time order.
The parts of a time series
- A time series is built from up to three parts:
- Trend (T) — the long-term direction: rising, falling or flat.
- Seasonal (S) — a regular pattern that repeats over a fixed period (e.g. every 4 quarters, every 12 months).
- Irregular — the random, unpredictable ups and downs left over.
- The additive model combines them:
Describing a time series
- Describe, always in context:
- the trend — e.g. "sales rise steadily over the three years",
- the seasonal pattern and its period — e.g. "a peak every summer quarter and a trough every winter quarter",
- any unusual points or sudden changes.
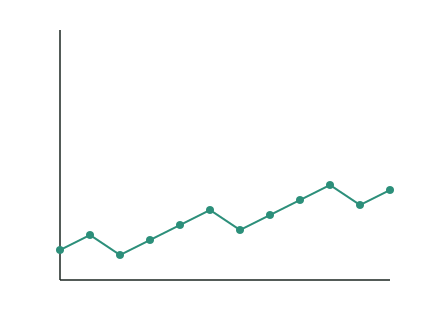
The plot above shows a shop's quarterly sales over three years. Describe the time series.
Trend
The overall level of sales rises steadily across the three years — an increasing trend.
Seasonal pattern
Within each year the sales follow a regular pattern that repeats every 4 quarters: a high quarter and a low quarter each year (a seasonal period of 4).
In context
So sales are growing over time (trend) while also swinging up and down with the seasons each year, with no obvious one-off unusual points.
Test yourself
Practice by grade
One question each at Achieved, Merit and Excellence. Have a go, then compare with the model answer.
A time series of monthly rainfall repeats a similar pattern every 12 months. What is this repeating pattern called, and what is its period?
A café's quarterly revenue rises over four years but is always highest in summer and lowest in winter. Describe the trend and the seasonal pattern in context.
In the additive model data = trend + seasonal + irregular, explain what each of the three parts represents, using quarterly ice-cream sales as an example.