Fitting a linear model
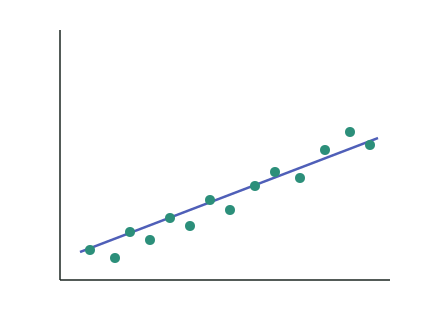
The line of best fit
- When the pattern is roughly linear, summarise it with a straight-line model (a linear regression):
- — the slope (gradient): the change in for each 1-unit increase in .
- — the intercept: the predicted when .
- Statistics software fits the line to sit as close as possible to all the points; your job is to interpret it.
Interpreting the slope and intercept in context
- Slope in context: "for each extra 1 unit of , the [response] increases (or decreases) by about [units of ], on average."
- Intercept in context: the predicted response when — but this is only meaningful if is within or near the data.
- Always attach units and say "on average" — the model is a summary of a trend, not an exact rule.
A linear model for the plant data is , where is fertiliser (g) and is height (cm). Interpret the slope and the intercept.
Slope
The slope is : for each extra gram of fertiliser, plant height increases by about cm on average.
Intercept
The intercept is : the model predicts a height of about cm when no fertiliser is applied (). This is only meaningful if is close to the measured data.
Test yourself
Practice by grade
One question each at Achieved, Merit and Excellence. Have a go, then compare with the model answer.
A linear model is . State the slope and the intercept.
A model for a car's value is , where is the car's age in years and is its value in dollars. Interpret the slope in context.
For the model (car value in dollars, age in years), interpret the intercept and comment on whether it is meaningful.