Running the simulation and estimating the probability
Running the trials
- Generate the random numbers, read them in groups the size of one trial, and record the result of each trial in a table or tally.
- Keep going until you have your planned number of trials.
The distribution of results
- Plotting how often each result happened gives the distribution of the outcome — a bar graph or dot plot.
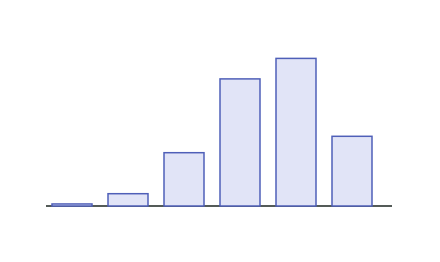
- Reading the distribution tells you which results are common and which are rare — here, most trials of 5 shots give 3 or 4 makes, and 0 makes almost never happens.
Estimating the probability
- The estimate is the relative frequency — how often the event happened out of all trials:
- Count the trials where the event occurred, divide by the total, and state the estimate (as a fraction, decimal or percentage), in context.
Using the distribution above (200 trials of 5 free throws), estimate the probability that the player makes at least 4 of 5 shots.
Step 1 — Count the trials with the event
"At least 4 makes" means 4 makes or 5 makes:
Step 2 — Divide by the total
Step 3 — State it in context
Test yourself
Practice by grade
One question each at Achieved, Merit and Excellence. Have a go, then compare with the model answer.
Achieved
In 50 simulated trials, an event happened 18 times. Estimate its probability.
Merit
A simulation of the number of rainy days in 3 days gave: 0 days ×72, 1 day ×86, 2 days ×34, 3 days ×8 (200 trials). Estimate the probability of rain on at least 2 of the 3 days.
Excellence
From the same simulation, a student estimates P(at least 2 rainy days) = 0.21. The true theoretical value is 0.352. Suggest why the estimate differs and how to improve it.