Choosing the topic, and describing the pattern
What makes a topic global
- The standard defines global as regions or nations across different continents or hemispheres. Two neighbouring countries, or one continent, is not enough.
- The topic must have a spatial dimension — a pattern that varies across the world in a way you can map and describe.
- The test: does the pattern only make sense at world scale? If the same analysis would work for one country, choose something else.
- Good topics: water scarcity, food security, migration flows, urbanisation, energy production and consumption, deforestation, global trade in a commodity, disease distribution, e-waste flows, tourism.
- Weak topics: anything national in scope, anything with no measurable distribution, or a topic so broad — climate change — that no single pattern can be described in 3 credits.
Narrowing a topic until it is workable
- Broad topics have to be narrowed to one measurable pattern. Water is not a topic; the global pattern of physical and economic water scarcity is.
- Narrow by variable. Choose one thing that can be measured for most countries — a rate, a percentage, a per-capita figure.
- Narrow by question. Where is it worst, and why? is enough for 3 credits, and it maps directly to the standard's three parts.
- Check you can get data for both hemispheres and several continents, because the definition requires it.
- Check you can find causes at more than one scale — a global process, and something that varies between countries.
Sourcing global data honestly
- Use a named, current source for every figure: a UN agency, the FAO, the World Bank, the IEA, or an equivalent assessment. Name it in the text, not only in a bibliography.
- Round, and say so. About 2 billion people rather than a precise-looking number that implies a count nobody made.
- Check the year. Global estimates are revised, and a figure from a decade ago describes a different world.
- Beware of a figure with no method behind it. If you cannot find out what was counted, do not use it as your headline evidence.
- Two sources that disagree are useful, not embarrassing: report both, say why they differ, and use it in your evaluation.
Describing the pattern with geographic terminology
- Level 3 requires the description to use geographic terminology, which Level 2 does not. That is a specific, checkable difference.
- The terminology to use: distribution, concentration, dispersal, cluster, core and periphery, latitude, hemisphere, arid, semi-arid, coastal, interior, densely and sparsely populated, north–south, gradient.
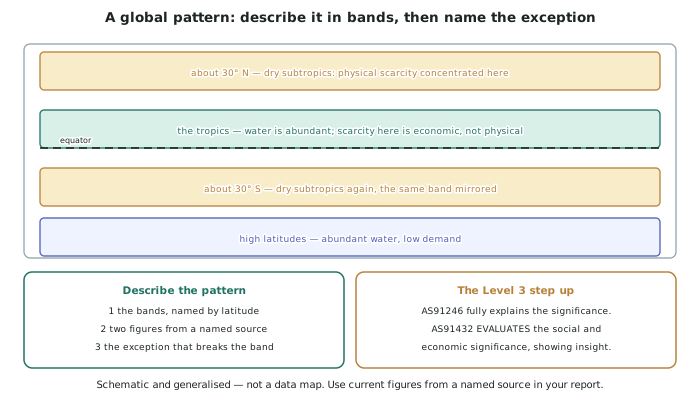
- Describe in three moves: the overall distribution, then two or three located examples with figures, then the exception that breaks the pattern.
- Use bands, regions and hemispheres rather than lists of countries. Concentrated in the arid and semi-arid belts around 30° north and south is a geographic description; Egypt, Libya, Saudi Arabia, Australia… is a list.
- Name the anomaly. A country that sits inside a band and behaves differently is the most interesting thing on your map, and it usually points at a cause.
Mapping the pattern yourself
- A world distribution map is the core evidence of this standard, and you should make one rather than reproduce one.
- A choropleth is usually right: shade countries or regions by your chosen variable, in classes that do not overlap, light to dark in one direction.
- Conventions still apply: title, key with class boundaries and units, source, and date of data.
- Add a second figure if the pattern has a flow: an arrow map for migration, trade or e-waste is far better than shading.
- Refer to your map in the text: as Figure 1 shows, the concentration in the 20–35° north band…
The worked topic: water scarcity, with the health warning attached
- The pattern, in general terms: water scarcity is concentrated in the arid and semi-arid belts around 30° north and south, in the interiors of large continents, and in densely populated river basins where demand has outgrown supply.
- Two kinds of scarcity, and the distinction is the whole topic: physical scarcity, where there is not enough water; and economic scarcity, where water exists but the infrastructure and finance to deliver it do not.
- Physical scarcity clusters in the dry subtropics; economic scarcity clusters in parts of the humid tropics — which is why a rainfall map and a scarcity map do not match.
- The approximate scale: UN assessments have put the number of people living in countries experiencing high water stress at roughly 2 billion, and around half the world's population at severe scarcity for at least part of the year. These are rounded, they are estimates, and you must check current figures from a named source.
- The anomaly worth naming: several wet, tropical countries record high scarcity, which physical shortage cannot explain — and that is the door into the causes section.
Worked Example
Worked example
A student proposes: "My global topic is climate change."
Diagnose the topic, then narrow it and describe the resulting pattern.
Answer:
Step 1 — test it against the standard.
Global? Yes. A geographic topic? Yes. But is there one describable pattern? No — climate change has dozens: emissions by country, temperature anomaly, sea-level exposure, agricultural yield change, displacement. A description that tries to cover them all will describe none of them, and the causes section will collapse into generality.
Step 2 — narrow it to one measurable variable.
Choose water scarcity: it can be measured for most countries, it has a clear global distribution, and it has causes at more than one scale.
Step 3 — decide what to measure and where the data comes from.
The variable is the proportion of the population living under high water stress, taken from a named UN or FAO-type assessment, with the year stated and the figures rounded.
Step 4 — describe the pattern in three moves, using geographic terminology.
Overall distribution. Water scarcity is concentrated in the arid and semi-arid belts around 30° north and south, in the interiors of the large continents, and in densely populated river basins where demand has outgrown supply. It is dispersed and low in the humid tropics and in the high latitudes of both hemispheres.
Located examples with figures. The most severe concentration is in the North Africa–West Asia belt, where a majority of countries fall in the highest stress class. A second, different concentration lies in the densely populated basins of South Asia, where the physical supply is far larger but the population using it is larger still. Globally, UN assessments have put roughly 2 billion people in countries experiencing high water stress, and around half the world's population at severe scarcity for at least part of the year — approximate figures that must be checked against a current source.
The exception. Several countries in the humid tropics, with abundant rainfall, record high scarcity. Physical shortage cannot explain this, and the anomaly is the strongest clue to the causes: scarcity here is economic, not physical — the water exists and the means to store, treat and deliver it do not.
Step 5 — check the terminology requirement.
Concentrated, dispersed, belts, latitude, interiors, densely populated, humid tropics, high latitudes, hemispheres. The description is built out of geographic terms rather than a list of country names, which is what the Level 3 criterion asks for.